Report: Mississippi spending on COVID-19 testing, treatment less than national average
Published 3:23 pm Friday, October 30, 2020
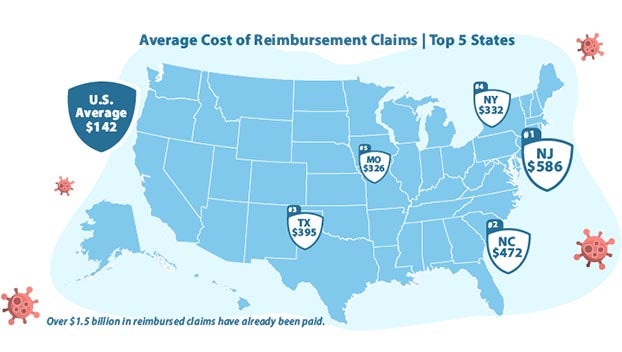
Mississippi spends less than the national average for testing and treatment of COVID-19 cases.
In a recent report, Mississippi ranked No. 17 among the 50 states when it comes to how much the state is spending on testing and treatment of COVID-19 cases. Mississippi spends approximately $137 per COVID-19 case. The national average is $142 per COVID-19 case. Comparatively, New Jersey — which ranks with the highest spending — spends approximately $586 per COVID-19 case. Montana, which ranks at the bottom, spends approximately $8 per COVID-19 case.
The United States is leading the world in total cases of COVID-19, with over 8 million. The high number of cases is perceived as troublesome, especially given the United States’ lack of health insurance among citizens.
Pandemic job losses have led to over 5 million people losing employer-sponsored health insurance coverage, and an estimated 10 million will have lost their employer coverage by the end of 2020. Congress did step up in a big way with the Families First Coronavirus Response Act and the Coronavirus Air, Relief, and Economic Security act. Each economic relief package gives over $176 billion for testing and treatment of COVID-19 for people without health insurance.
Officials at QuoteWizard analyzed CDC data that looked to total reimbursements in each state to see where the highest average rate of funds have been used so far.
To evaluate how much each state is spending on testing and treatment, we looked at the total dollar figure between testing and treatment then divided that total by the total number of COVID-19 cases in each state to arrive at a cost-per-case figure. This figure represents a per-person metric that shows how states have utilized testing and treatment for uninsured people. When looking at the top states for cost per case, these are states that have been hit particularly hard by COVID-19 cases. Because of the high number of cases, there has also been a large utilization of testing and treatment. These are states that have acted in deploying widespread testing and treatment.
However, these high costs per case are also a sign of high levels of uninsured people in these states. Over half of the top states for cost per case are also states with the highest rates of uninsured people. This would signal that while testing and treatment has been utilized more, it’s because there are more uninsured people in these states that need to be reimbursed. Texas, for example, is the third-highest cost per case at $395. Texas also has the highest uninsured rate in the country at 18%. Texas is a case where an already-high rate of uninsured people means the high cost per case is likely due to a large number of uninsured people that are being reimbursed. New Jersey, on the other side of the coin, had the highest cost per case at $586 but only has a 7% uninsured rate. New Jersey’s low uninsured rate and high cost per case is likely a result of full utilization of testing and treatment resources in the state. The mobilization of testing and treatment in New Jersey could be looked at as a successful rollout of needed resources compared to other states.
Below is the full ranking of all of the states:
| Rank | State | COVID-19 Cases | Testing Claims | Treatment Claims |
Cost per COVID-19 Case
|
|---|---|---|---|---|---|
| 1 | New Jersey | 222,193 | $46,149,797 | $83,973,205 | $586 |
| 2 | North Carolina | 248,750 | $77,367,001 | $40,085,455 | $472 |
| 3 | Texas | 833,557 | $58,658,376 | $270,822,786 | $395 |
| 4 | New York | 231,273 | $32,449,380 | $44,430,614 | $332 |
| 5 | Missouri | 159,625 | $44,195,768 | $7,883,605 | $326 |
| 6 | Maryland | 137,236 | $5,910,713 | $28,817,971 | $253 |
| 7 | Georgia | 342,438 | $22,511,848 | $58,840,682 | $238 |
| 8 | Virginia | 168,772 | $7,422,381 | $29,489,278 | $219 |
| 9 | Florida | 750,739 | $45,139,106 | $100,000,567 | $193 |
| 10 | Tennessee | 233,569 | $19,150,481 | $22,926,658 | $180 |
| 11 | Kansas | 72,968 | $8,328,949 | $4,615,588 | $177 |
| 12 | Nevada | 91,592 | $5,348,476 | $10,664,850 | $175 |
| 13 | Colorado | 87,582 | $3,852,747 | $11,028,788 | $170 |
| 14 | Vermont | 1,956 | $123,729 | $181,416 | $156 |
| 15 | Illinois | 354,462 | $16,226,392 | $37,247,645 | $151 |
| 16 | Maine | 5,989 | $658,908 | $175,268 | $139 |
| 17 | Mississippi | 112,123 | $6,475,454 | $8,910,626 | $137 |
| 18 | Delaware | 23,325 | $940,260 | $2,216,265 | $135 |
| 19 | Louisiana | 179,769 | $11,564,111 | $12,280,030 | $133 |
| 20 | Washington | 99,150 | $4,190,964 | $8,660,239 | $130 |
| 21 | New Mexico | 37,896 | $3,380,444 | $1,427,648 | $127 |
| 22 | Alabama | 174,528 | $10,053,806 | $11,936,773 | $126 |
| 23 | Oklahoma | 115,877 | $7,464,158 | $6,949,785 | $124 |
| 24 | Connecticut | 64,455 | $1,767,285 | $6,103,446 | $122 |
| 25 | South Carolina | 165,493 | $7,075,761 | $12,382,808 | $118 |
| 26 | Pennsylvania | 184,872 | $8,375,507 | $13,047,425 | $116 |
| 27 | Nebraska | 59,409 | $1,324,837 | $5,557,393 | $116 |
| 28 | Idaho | 54,663 | $4,344,992 | $1,688,064 | $110 |
| 29 | Massachusetts | 152,191 | $8,685,033 | $6,578,478 | $100 |
| 30 | Utah | 96,643 | $3,376,403 | $6,289,886 | $100 |
| 31 | South Dakota | 34,457 | $949,531 | $2,447,036 | $99 |
| 32 | Oregon | 40,136 | $2,393,104 | $1,471,456 | $96 |
| 33 | Minnesota | 125,531 | $4,531,937 | $7,533,013 | $96 |
| 34 | Indiana | 150,664 | $5,063,500 | $9,228,356 | $95 |
| 35 | California | 874,077 | $41,387,954 | $36,710,848 | $89 |
| 36 | Arizona | 232,937 | $9,238,176 | $11,051,288 | $87 |
| 37 | Rhode Island | 28,649 | $370,732 | $1,996,055 | $83 |
| 38 | Arkansas | 100,441 | $3,835,064 | $4,057,018 | $79 |
| 39 | Ohio | 185,639 | $5,267,046 | $8,645,689 | $75 |
| 40 | New Hampshire | 9,828 | $461,117 | $272,541 | $75 |
| 41 | Michigan | 165,994 | $5,906,446 | $4,866,172 | $65 |
| 42 | Hawaii | 14,108 | $663,151 | $174,442 | $59 |
| 43 | Wyoming | 9,526 | $280,399 | $279,152 | $59 |
| 44 | Kentucky | 89,544 | $2,399,029 | $881,841 | $37 |
| 45 | Wisconsin | 187,828 | $2,310,071 | $4,070,110 | $34 |
| 46 | Alaska | 11,393 | $320,673 | $57,214 | $33 |
| 47 | Iowa | 108,691 | $957,898 | $2,473,391 | $32 |
| 48 | North Dakota | 34,165 | $560,357 | $377,916 | $27 |
| 49 | West Virginia | 20,519 | $362,053 | $57,791 | $20 |
| 50 | Montana | 24,093 | $96,629 | $103,263 | $8 |