Although Mississippi’s population may be shrinking, some areas are growing. Here is a list of the fastest-growing counties in Mississippi
Published 1:33 pm Wednesday, June 2, 2021
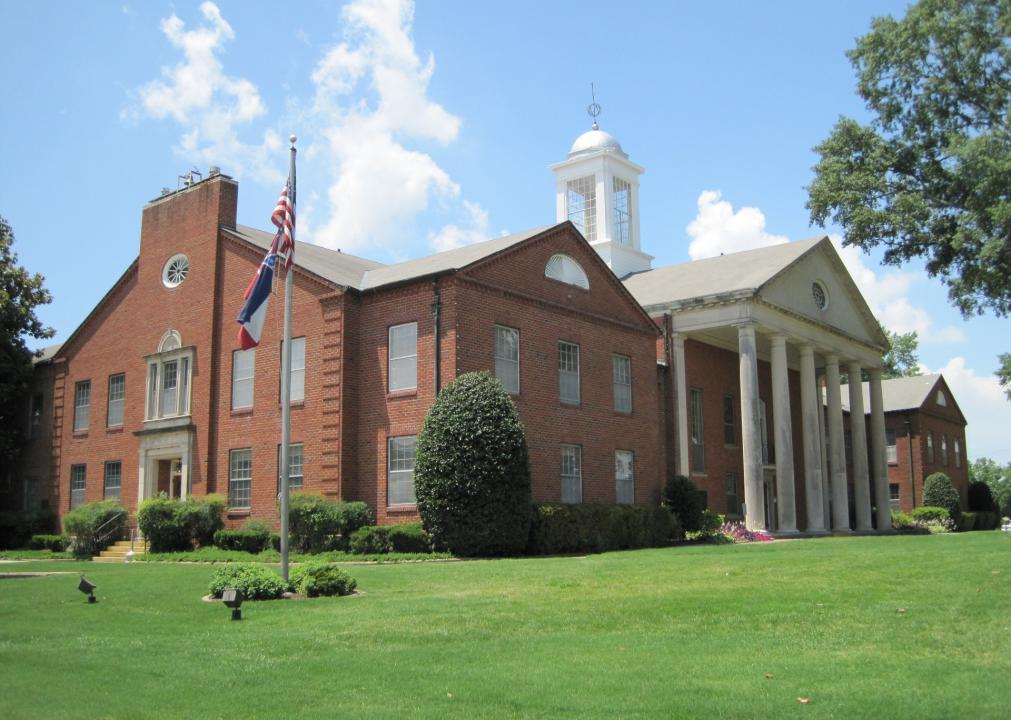
Thomas R Machnitzki // Wikimedia Commons
Fastest-growing counties in Mississippi
From 2018 to 2019, the U.S. population grew by .48%, its slowest rate in 100 years. Declining births, increasing deaths largely due to the graying Baby Boomer population, and a crackdown on immigration have contributed to many states seeing net population losses in recent years.
But in other pockets of the country, populations are growing. These shifts can be due to job opportunities, high quality of life, easy commutability to job centers, low rents, or any combination of these or other factors. Stacker compiled a list of the fastest-growing counties in Mississippi using data from the U.S. Census Bureau. Counties are ranked by the highest population growth from 2010 to 2019, based on 5-year estimates.
A county typically sees population growth as a “bedroom community” (a municipality with an atypically large commuting population) to a large city. These communities are typically quieter than their feeder cities, offer lower rents and a higher quality of living, and are remote enough to be immune to the feeder city’s crime, traffic, and crowds. Keep reading to see if your home county made the list.
NatalieMaynor // Wikimedia Commons
#30. Webster County
– 2010 to 2019 population change: -371
— #2,160 among all counties nationwide
– 2010 to 2019 percent population change: -3.7%
— #44 among counties in Mississippi, #2,368 among all counties nationwide
– 2019 population: 9,768
— #72 largest county in Mississippi, #2,446 largest county nationwide
Jerrye & Roy Klotz, MD // Wikimedia Commons
#29. Greene County
– 2010 to 2019 population change: -364
— #2,156 among all counties nationwide
– 2010 to 2019 percent population change: -2.6%
— #34 among counties in Mississippi, #2,147 among all counties nationwide
– 2019 population: 13,645
— #61 largest county in Mississippi, #2,185 largest county nationwide
Leigh T. Harrell // Wikimedia Commons
#28. Lowndes County
– 2010 to 2019 population change: -332
— #2,106 among all counties nationwide
– 2010 to 2019 percent population change: -0.6%
— #24 among counties in Mississippi, #1,681 among all counties nationwide
– 2019 population: 59,150
— #12 largest county in Mississippi, #876 largest county nationwide
Courtesy of the Mississippi Department of Archives and History // Wikimedia Commons
#27. Lincoln County
– 2010 to 2019 population change: -302
— #2,064 among all counties nationwide
– 2010 to 2019 percent population change: -0.9%
— #27 among counties in Mississippi, #1,751 among all counties nationwide
– 2019 population: 34,320
— #23 largest county in Mississippi, #1,317 largest county nationwide
Calvin Beale // Wikimedia Commons
#26. Perry County
– 2010 to 2019 population change: -237
— #1,954 among all counties nationwide
– 2010 to 2019 percent population change: -1.9%
— #31 among counties in Mississippi, #1,980 among all counties nationwide
– 2019 population: 12,006
— #65 largest county in Mississippi, #2,293 largest county nationwide
CapCase // Wikimedia Commons
#25. Neshoba County
– 2010 to 2019 population change: -213
— #1,919 among all counties nationwide
– 2010 to 2019 percent population change: -0.7%
— #26 among counties in Mississippi, #1,721 among all counties nationwide
– 2019 population: 29,332
— #28 largest county in Mississippi, #1,445 largest county nationwide
Cohee // Wikimedia Commons
#24. Prentiss County
– 2010 to 2019 population change: -156
— #1,805 among all counties nationwide
– 2010 to 2019 percent population change: -0.6%
— #25 among counties in Mississippi, #1,693 among all counties nationwide
– 2019 population: 25,255
— #37 largest county in Mississippi, #1,595 largest county nationwide
Skye Marthaler // Wikimedia Commons
#23. Tishomingo County
– 2010 to 2019 population change: -94
— #1,697 among all counties nationwide
– 2010 to 2019 percent population change: -0.5%
— #23 among counties in Mississippi, #1,655 among all counties nationwide
– 2019 population: 19,441
— #48 largest county in Mississippi, #1,855 largest county nationwide
Cohee // Wikimedia Commons
#22. Tippah County
– 2010 to 2019 population change: +25
— #1,524 among all counties nationwide
– 2010 to 2019 percent population change: +0.1%
— #22 among counties in Mississippi, #1,537 among all counties nationwide
– 2019 population: 22,018
— #43 largest county in Mississippi, #1,725 largest county nationwide
Fredlyfish4 // Wikimedia Commons
#21. Itawamba County
– 2010 to 2019 population change: +133
— #1,395 among all counties nationwide
– 2010 to 2019 percent population change: +0.6%
— #20 among counties in Mississippi, #1,450 among all counties nationwide
– 2019 population: 23,462
— #40 largest county in Mississippi, #1,660 largest county nationwide
Larry D. Moore // Wikimedia Commons
#20. Scott County
– 2010 to 2019 population change: +152
— #1,382 among all counties nationwide
– 2010 to 2019 percent population change: +0.5%
— #21 among counties in Mississippi, #1,455 among all counties nationwide
– 2019 population: 28,332
— #34 largest county in Mississippi, #1,483 largest county nationwide
Chillin662 // Wikimedia Commons
#19. Yazoo County
– 2010 to 2019 population change: +163
— #1,374 among all counties nationwide
– 2010 to 2019 percent population change: +0.6%
— #19 among counties in Mississippi, #1,448 among all counties nationwide
– 2019 population: 28,565
— #30 largest county in Mississippi, #1,471 largest county nationwide
Catherine Harris // Wikimedia Commons
#18. Tate County
– 2010 to 2019 population change: +206
— #1,336 among all counties nationwide
– 2010 to 2019 percent population change: +0.7%
— #18 among counties in Mississippi, #1,425 among all counties nationwide
– 2019 population: 28,404
— #33 largest county in Mississippi, #1,480 largest county nationwide
Skye Marthaler // Wikimedia Commons
#17. Alcorn County
– 2010 to 2019 population change: +382
— #1,216 among all counties nationwide
– 2010 to 2019 percent population change: +1.0%
— #17 among counties in Mississippi, #1,363 among all counties nationwide
– 2019 population: 37,090
— #20 largest county in Mississippi, #1,245 largest county nationwide
Sturmgewehr88 // Wikimedia
#16. Forrest County
– 2010 to 2019 population change: +934
— #996 among all counties nationwide
– 2010 to 2019 percent population change: +1.3%
— #16 among counties in Mississippi, #1,328 among all counties nationwide
– 2019 population: 75,224
— #9 largest county in Mississippi, #736 largest county nationwide
Librarylady2726 // Wikimedia Commons
#15. Jones County
– 2010 to 2019 population change: +1,208
— #928 among all counties nationwide
– 2010 to 2019 percent population change: +1.8%
— #15 among counties in Mississippi, #1,237 among all counties nationwide
– 2019 population: 68,352
— #10 largest county in Mississippi, #779 largest county nationwide
Woodlot // Wikimedia Commons
#14. Stone County
– 2010 to 2019 population change: +1,353
— #893 among all counties nationwide
– 2010 to 2019 percent population change: +8.0%
— #9 among counties in Mississippi, #536 among all counties nationwide
– 2019 population: 18,276
— #51 largest county in Mississippi, #1,906 largest county nationwide
Cohee // Wikimedia Commons
#13. Union County
– 2010 to 2019 population change: +1,585
— #840 among all counties nationwide
– 2010 to 2019 percent population change: +5.9%
— #12 among counties in Mississippi, #710 among all counties nationwide
– 2019 population: 28,507
— #31 largest county in Mississippi, #1,477 largest county nationwide
dmtilley // Wikimedia Commons
#12. George County
– 2010 to 2019 population change: +1,856
— #797 among all counties nationwide
– 2010 to 2019 percent population change: +8.4%
— #8 among counties in Mississippi, #504 among all counties nationwide
– 2019 population: 23,917
— #39 largest county in Mississippi, #1,644 largest county nationwide
Michaelswikiusername // Wikimedia Commons
#11. Pontotoc County
– 2010 to 2019 population change: +2,095
— #756 among all counties nationwide
– 2010 to 2019 percent population change: +7.1%
— #10 among counties in Mississippi, #608 among all counties nationwide
– 2019 population: 31,618
— #26 largest county in Mississippi, #1,386 largest county nationwide
Mthunter58 // Wikimedia Commons
#10. Oktibbeha County
– 2010 to 2019 population change: +2,983
— #666 among all counties nationwide
– 2010 to 2019 percent population change: +6.4%
— #11 among counties in Mississippi, #657 among all counties nationwide
– 2019 population: 49,512
— #15 largest county in Mississippi, #993 largest county nationwide
Cohee // Wikimedia Commons
#9. Lee County
– 2010 to 2019 population change: +3,626
— #614 among all counties nationwide
– 2010 to 2019 percent population change: +4.5%
— #13 among counties in Mississippi, #862 among all counties nationwide
– 2019 population: 85,072
— #7 largest county in Mississippi, #670 largest county nationwide
Infrogmation of New Orleans // Wikimedia Commons
#8. Hancock County
– 2010 to 2019 population change: +4,553
— #563 among all counties nationwide
– 2010 to 2019 percent population change: +10.7%
— #6 among counties in Mississippi, #357 among all counties nationwide
– 2019 population: 46,961
— #16 largest county in Mississippi, #1,033 largest county nationwide
Quentin Melson // Wikimedia Commons
#7. Jackson County
– 2010 to 2019 population change: +5,294
— #528 among all counties nationwide
– 2010 to 2019 percent population change: +3.9%
— #14 among counties in Mississippi, #931 among all counties nationwide
– 2019 population: 142,376
— #5 largest county in Mississippi, #455 largest county nationwide
Jerrye & Roy Klotz, MD // Wikimedia Commons
#6. Lafayette County
– 2010 to 2019 population change: +7,731
— #445 among all counties nationwide
– 2010 to 2019 percent population change: +16.9%
— #2 among counties in Mississippi, #153 among all counties nationwide
– 2019 population: 53,590
— #14 largest county in Mississippi, #941 largest county nationwide
The diva777 // Wikimedia Commons
#5. Lamar County
– 2010 to 2019 population change: +9,410
— #406 among all counties nationwide
– 2010 to 2019 percent population change: +17.9%
— #1 among counties in Mississippi, #132 among all counties nationwide
– 2019 population: 61,969
— #11 largest county in Mississippi, #846 largest county nationwide
Scoutandboo // Wikimedia Commons
#4. Madison County
– 2010 to 2019 population change: +12,575
— #347 among all counties nationwide
– 2010 to 2019 percent population change: +13.7%
— #4 among counties in Mississippi, #229 among all counties nationwide
– 2019 population: 104,562
— #6 largest county in Mississippi, #575 largest county nationwide
NatalieMaynor // Wikimedia Commons
#3. Rankin County
– 2010 to 2019 population change: +14,154
— #328 among all counties nationwide
– 2010 to 2019 percent population change: +10.2%
— #7 among counties in Mississippi, #389 among all counties nationwide
– 2019 population: 152,677
— #4 largest county in Mississippi, #432 largest county nationwide
Woodlot // Wikimedia Commons
#2. Harrison County
– 2010 to 2019 population change: +22,711
— #239 among all counties nationwide
– 2010 to 2019 percent population change: +12.5%
— #5 among counties in Mississippi, #272 among all counties nationwide
– 2019 population: 204,502
— #2 largest county in Mississippi, #324 largest county nationwide
Thomas R Machnitzki // Wikimedia Commons
#1. DeSoto County
– 2010 to 2019 population change: +24,260
— #226 among all counties nationwide
– 2010 to 2019 percent population change: +15.7%
— #3 among counties in Mississippi, #182 among all counties nationwide
– 2019 population: 178,975
— #3 largest county in Mississippi, #365 largest county nationwide


