Think you know where the most diverse counties in Mississippi are? Check out our list
Published 7:56 am Wednesday, June 16, 2021
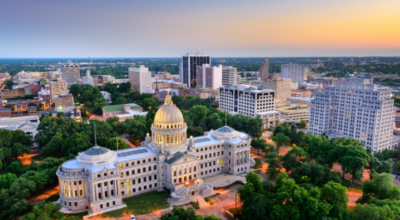
CapCase // Wikimedia Commons
Most diverse counties in Mississippi
The United States has a longstanding reputation as being a melting pot (or salad bowl), with its diversity manifesting itself across many different demographics. However, some places across the country are notably more heterogeneous than others.
Stacker compiled a list of the most diverse counties in Mississippi using data from using data from the U.S. Census Bureau. Counties are ranked by the highest Simpson’s diversity index score. Simpson’s diversity index measures community diversity on a scale of 0 (least diverse) to 1 (most diverse), more on the calculation can be read here.
Think you know which counties in your home state might be the most diverse? Keep reading to see if your predictions are correct.
You may also like: Biggest sources of immigrants to Mississippi

Brian Stansberry // Wikimedia Commons
#50. Monroe County
– Index: 0.439
– Total population: 35,673
– White: 68.1% (24,288)
– Black or African American: 31.2% (11,132)
– American Indian and Alaska Native: 0.0% (8)
– Asian: 0.1% (31)
– Native Hawaiian and other Pacific Islander: 0.0% (0)
– 2 or more races: 0.5% (195)
– Some other Race: 0.1% (19)
Courtesy of the Mississippi Department of Archives and History // Wikimedia Commons
#49. Lincoln County
– Index: 0.443
– Total population: 34,320
– White: 67.5% (23,159)
– Black or African American: 31.9% (10,957)
– American Indian and Alaska Native: 0.0% (5)
– Asian: 0.5% (165)
– Native Hawaiian and other Pacific Islander: 0.0% (0)
– 2 or more races: 0.1% (34)
– Some other Race: 0.0% (0)
Librarylady2726 // Wikimedia Commons
#48. Jones County
– Index: 0.443
– Total population: 68,352
– White: 68.6% (46,881)
– Black or African American: 29.4% (20,077)
– American Indian and Alaska Native: 0.2% (154)
– Asian: 0.3% (225)
– Native Hawaiian and other Pacific Islander: 0.1% (47)
– 2 or more races: 1.0% (691)
– Some other Race: 0.4% (277)
Nick Shields // Wikimedia Commons
#47. Choctaw County
– Index: 0.444
– Total population: 8,277
– White: 67.8% (5,611)
– Black or African American: 31.0% (2,566)
– American Indian and Alaska Native: 0.4% (34)
– Asian: 0.0% (2)
– Native Hawaiian and other Pacific Islander: 0.1% (8)
– 2 or more races: 0.5% (43)
– Some other Race: 0.2% (13)
Quentin Melson // Wikimedia Commons
#46. Jackson County
– Index: 0.452
– Total population: 142,376
– White: 70.8% (100,751)
– Black or African American: 21.3% (30,305)
– American Indian and Alaska Native: 0.4% (609)
– Asian: 2.4% (3,434)
– Native Hawaiian and other Pacific Islander: 0.1% (82)
– 2 or more races: 2.4% (3,353)
– Some other Race: 2.7% (3,842)
You may also like: Highest-rated things to do in Mississippi, according to Tripadvisor

Zeamays // Wikimedia Commons
#45. Carroll County
– Index: 0.463
– Total population: 10,070
– White: 64.5% (6,499)
– Black or African American: 34.7% (3,499)
– American Indian and Alaska Native: 0.0% (5)
– Asian: 0.0% (0)
– Native Hawaiian and other Pacific Islander: 0.0% (0)
– 2 or more races: 0.7% (67)
– Some other Race: 0.0% (0)
Cohee // Wikimedia Commons
#44. Lee County
– Index: 0.465
– Total population: 85,072
– White: 66.9% (56,904)
– Black or African American: 29.5% (25,089)
– American Indian and Alaska Native: 0.3% (225)
– Asian: 1.0% (833)
– Native Hawaiian and other Pacific Islander: 0.0% (7)
– 2 or more races: 1.1% (920)
– Some other Race: 1.3% (1,094)
Catherine Harris // Wikimedia Commons
#43. Tate County
– Index: 0.467
– Total population: 28,404
– White: 66.5% (18,895)
– Black or African American: 29.9% (8,494)
– American Indian and Alaska Native: 0.1% (34)
– Asian: 0.1% (41)
– Native Hawaiian and other Pacific Islander: 0.1% (34)
– 2 or more races: 2.6% (742)
– Some other Race: 0.6% (164)
Gabriel D. May // Wikimedia Commons
#42. Marion County
– Index: 0.468
– Total population: 24,990
– White: 65.3% (16,308)
– Black or African American: 32.6% (8,140)
– American Indian and Alaska Native: 0.0% (0)
– Asian: 0.5% (131)
– Native Hawaiian and other Pacific Islander: 0.1% (21)
– 2 or more races: 0.2% (58)
– Some other Race: 1.3% (332)
Z28scrambler // Wikimedia Commons
#41. Franklin County
– Index: 0.469
– Total population: 7,733
– White: 63.4% (4,903)
– Black or African American: 36.0% (2,782)
– American Indian and Alaska Native: 0.2% (12)
– Asian: 0.1% (4)
– Native Hawaiian and other Pacific Islander: 0.0% (0)
– 2 or more races: 0.4% (30)
– Some other Race: 0.0% (2)
You may also like: Counties with the most college graduates in Mississippi

Jerrye & Roy Klotz, MD // Wikimedia Commons
#40. Clarke County
– Index: 0.470
– Total population: 15,770
– White: 63.6% (10,028)
– Black or African American: 35.5% (5,592)
– American Indian and Alaska Native: 0.1% (8)
– Asian: 0.0% (0)
– Native Hawaiian and other Pacific Islander: 0.0% (0)
– 2 or more races: 0.6% (92)
– Some other Race: 0.3% (50)
Calvin Beale // Wikimedia Commons
#39. Lawrence County
– Index: 0.471
– Total population: 12,633
– White: 65.0% (8,215)
– Black or African American: 32.5% (4,109)
– American Indian and Alaska Native: 0.2% (19)
– Asian: 0.2% (28)
– Native Hawaiian and other Pacific Islander: 0.0% (0)
– 2 or more races: 1.1% (143)
– Some other Race: 0.9% (119)
Nlsanfor // Wikimedia Commons
#38. Covington County
– Index: 0.474
– Total population: 18,978
– White: 62.6% (11,886)
– Black or African American: 36.6% (6,946)
– American Indian and Alaska Native: 0.2% (36)
– Asian: 0.0% (0)
– Native Hawaiian and other Pacific Islander: 0.0% (0)
– 2 or more races: 0.6% (108)
– Some other Race: 0.0% (2)
Woodlot // Wikimedia Commons
#37. Harrison County
– Index: 0.474
– Total population: 204,502
– White: 67.9% (138,940)
– Black or African American: 24.9% (50,994)
– American Indian and Alaska Native: 0.6% (1,127)
– Asian: 2.8% (5,813)
– Native Hawaiian and other Pacific Islander: 0.0% (64)
– 2 or more races: 2.9% (6,029)
– Some other Race: 0.8% (1,535)
Mississippi Department of Archives and History // Wikimedia Commons
#36. Issaquena County
– Index: 0.478
– Total population: 1,361
– White: 37.8% (514)
– Black or African American: 61.6% (839)
– American Indian and Alaska Native: 0.0% (0)
– Asian: 0.0% (0)
– Native Hawaiian and other Pacific Islander: 0.0% (0)
– 2 or more races: 0.0% (0)
– Some other Race: 0.6% (8)
You may also like: Counties with the oldest homes in Mississippi

Hamhari Brown // Wikimedia Commons
#35. Bolivar County
– Index: 0.479
– Total population: 31,848
– White: 33.0% (10,497)
– Black or African American: 64.2% (20,453)
– American Indian and Alaska Native: 0.1% (40)
– Asian: 0.9% (286)
– Native Hawaiian and other Pacific Islander: 0.0% (0)
– 2 or more races: 0.5% (148)
– Some other Race: 1.3% (424)
Thomas R Machnitzki // Wikimedia Commons
#34. DeSoto County
– Index: 0.479
– Total population: 178,975
– White: 66.7% (119,455)
– Black or African American: 27.3% (48,835)
– American Indian and Alaska Native: 0.2% (352)
– Asian: 1.4% (2,524)
– Native Hawaiian and other Pacific Islander: 0.0% (25)
– 2 or more races: 2.2% (3,967)
– Some other Race: 2.1% (3,817)
Calvin Beale // Wikimedia Commons
#33. Jefferson Davis County
– Index: 0.480
– Total population: 11,339
– White: 37.9% (4,303)
– Black or African American: 61.3% (6,950)
– American Indian and Alaska Native: 0.0% (0)
– Asian: 0.1% (14)
– Native Hawaiian and other Pacific Islander: 0.0% (0)
– 2 or more races: 0.5% (60)
– Some other Race: 0.1% (12)
Calvin Beale // Wikimedia Commons
#32. Simpson County
– Index: 0.483
– Total population: 26,888
– White: 61.8% (16,625)
– Black or African American: 36.6% (9,851)
– American Indian and Alaska Native: 0.0% (4)
– Asian: 0.6% (149)
– Native Hawaiian and other Pacific Islander: 0.0% (0)
– 2 or more races: 1.0% (259)
– Some other Race: 0.0% (0)
Carlcath // Wikimedia Commons
#31. Clay County
– Index: 0.489
– Total population: 19,640
– White: 38.8% (7,622)
– Black or African American: 60.0% (11,784)
– American Indian and Alaska Native: 0.5% (92)
– Asian: 0.3% (57)
– Native Hawaiian and other Pacific Islander: 0.0% (0)
– 2 or more races: 0.4% (85)
– Some other Race: 0.0% (0)
You may also like: Best places to retire in Mississippi

NatalieMaynor // Wikimedia Commons
#30. Yalobusha County
– Index: 0.494
– Total population: 12,367
– White: 59.0% (7,302)
– Black or African American: 39.7% (4,904)
– American Indian and Alaska Native: 0.1% (18)
– Asian: 0.2% (19)
– Native Hawaiian and other Pacific Islander: 0.0% (0)
– 2 or more races: 0.7% (92)
– Some other Race: 0.3% (32)
Mac H. Alford // Wikimedia Commons
#29. Amite County
– Index: 0.495
– Total population: 12,412
– White: 57.4% (7,119)
– Black or African American: 41.9% (5,202)
– American Indian and Alaska Native: 0.0% (3)
– Asian: 0.2% (23)
– Native Hawaiian and other Pacific Islander: 0.0% (0)
– 2 or more races: 0.3% (35)
– Some other Race: 0.2% (30)
Cohee // Wikimedia Commons
#28. Calhoun County
– Index: 0.496
– Total population: 14,499
– White: 65.2% (9,459)
– Black or African American: 27.4% (3,968)
– American Indian and Alaska Native: 0.0% (0)
– Asian: 0.2% (34)
– Native Hawaiian and other Pacific Islander: 0.0% (0)
– 2 or more races: 1.9% (272)
– Some other Race: 5.3% (766)
NatalieMaynor // Wikimedia Commons
#27. Kemper County
– Index: 0.499
– Total population: 9,943
– White: 34.5% (3,433)
– Black or African American: 61.7% (6,134)
– American Indian and Alaska Native: 3.7% (364)
– Asian: 0.1% (7)
– Native Hawaiian and other Pacific Islander: 0.0% (0)
– 2 or more races: 0.1% (5)
– Some other Race: 0.0% (0)
Calvin Beale // Wikimedia Commons
#26. Wayne County
– Index: 0.502
– Total population: 20,373
– White: 57.4% (11,695)
– Black or African American: 41.0% (8,359)
– American Indian and Alaska Native: 0.1% (17)
– Asian: 0.1% (26)
– Native Hawaiian and other Pacific Islander: 0.0% (0)
– 2 or more races: 0.8% (161)
– Some other Race: 0.6% (115)
You may also like: Counties with the most super commuters in Mississippi

Calvin Beale // Wikimedia Commons
#25. Walthall County
– Index: 0.505
– Total population: 14,477
– White: 52.9% (7,665)
– Black or African American: 46.3% (6,706)
– American Indian and Alaska Native: 0.0% (0)
– Asian: 0.1% (15)
– Native Hawaiian and other Pacific Islander: 0.0% (0)
– 2 or more races: 0.2% (28)
– Some other Race: 0.4% (63)
NatalieMaynor // Wikimedia Commons
#24. Jasper County
– Index: 0.505
– Total population: 16,505
– White: 44.7% (7,379)
– Black or African American: 54.3% (8,964)
– American Indian and Alaska Native: 0.0% (1)
– Asian: 0.0% (0)
– Native Hawaiian and other Pacific Islander: 0.0% (0)
– 2 or more races: 0.5% (89)
– Some other Race: 0.4% (72)
Cohee // Wikimedia Commons
#23. Benton County
– Index: 0.506
– Total population: 8,232
– White: 61.4% (5,051)
– Black or African American: 34.2% (2,813)
– American Indian and Alaska Native: 0.0% (0)
– Asian: 0.0% (0)
– Native Hawaiian and other Pacific Islander: 0.2% (15)
– 2 or more races: 3.0% (249)
– Some other Race: 1.3% (104)
Chillin662 // Wikimedia Commons
#22. Yazoo County
– Index: 0.508
– Total population: 28,565
– White: 36.9% (10,533)
– Black or African American: 59.6% (17,027)
– American Indian and Alaska Native: 0.3% (92)
– Asian: 0.4% (126)
– Native Hawaiian and other Pacific Islander: 0.0% (0)
– 2 or more races: 1.2% (343)
– Some other Race: 1.6% (444)
Sturmgewehr88 // Wikimedia
#21. Forrest County
– Index: 0.509
– Total population: 75,224
– White: 59.4% (44,649)
– Black or African American: 37.2% (27,951)
– American Indian and Alaska Native: 0.2% (163)
– Asian: 0.8% (639)
– Native Hawaiian and other Pacific Islander: 0.0% (30)
– 2 or more races: 2.1% (1,594)
– Some other Race: 0.3% (198)
You may also like: Highest-rated specialty museums in Mississippi, according to Tripadvisor

Matthew Nichols // Wikimedia Commons
#20. Grenada County
– Index: 0.510
– Total population: 21,088
– White: 54.9% (11,577)
– Black or African American: 43.4% (9,161)
– American Indian and Alaska Native: 0.7% (148)
– Asian: 0.2% (46)
– Native Hawaiian and other Pacific Islander: 0.0% (0)
– 2 or more races: 0.7% (140)
– Some other Race: 0.1% (16)
Z28scrambler // Wikimedia Commons
#19. Pike County
– Index: 0.513
– Total population: 39,532
– White: 43.8% (17,315)
– Black or African American: 54.3% (21,456)
– American Indian and Alaska Native: 0.5% (198)
– Asian: 0.3% (125)
– Native Hawaiian and other Pacific Islander: 0.0% (0)
– 2 or more races: 0.7% (269)
– Some other Race: 0.4% (169)
Z28scrambler // Wikimedia Commons
#18. Adams County
– Index: 0.515
– Total population: 31,266
– White: 40.9% (12,796)
– Black or African American: 56.3% (17,610)
– American Indian and Alaska Native: 0.3% (95)
– Asian: 0.6% (187)
– Native Hawaiian and other Pacific Islander: 0.0% (0)
– 2 or more races: 1.1% (338)
– Some other Race: 0.8% (240)
Dudemanfellabra // Wikimedia Commons
#17. Lauderdale County
– Index: 0.515
– Total population: 76,279
– White: 54.2% (41,343)
– Black or African American: 43.7% (33,333)
– American Indian and Alaska Native: 0.2% (153)
– Asian: 0.7% (505)
– Native Hawaiian and other Pacific Islander: 0.0% (35)
– 2 or more races: 0.7% (558)
– Some other Race: 0.5% (352)
Renelibrary // Wikimedia Commons
#16. Warren County
– Index: 0.523
– Total population: 46,519
– White: 48.3% (22,470)
– Black or African American: 49.4% (22,978)
– American Indian and Alaska Native: 0.3% (121)
– Asian: 0.7% (332)
– Native Hawaiian and other Pacific Islander: 0.0% (8)
– 2 or more races: 0.9% (438)
– Some other Race: 0.4% (172)
You may also like: Counties with the worst commutes in Mississippi

Leigh T. Harrell // Wikimedia Commons
#15. Lowndes County
– Index: 0.523
– Total population: 59,150
– White: 53.4% (31,595)
– Black or African American: 43.8% (25,902)
– American Indian and Alaska Native: 0.1% (83)
– Asian: 1.0% (602)
– Native Hawaiian and other Pacific Islander: 0.0% (10)
– 2 or more races: 1.3% (792)
– Some other Race: 0.3% (166)
Qqqqqq // Wikimedia Commons
#14. Montgomery County
– Index: 0.525
– Total population: 10,068
– White: 52.9% (5,324)
– Black or African American: 44.2% (4,446)
– American Indian and Alaska Native: 0.0% (0)
– Asian: 0.3% (29)
– Native Hawaiian and other Pacific Islander: 0.0% (0)
– 2 or more races: 2.1% (214)
– Some other Race: 0.5% (55)
Mark Hilton // Wikimedia Commons
#13. Winston County
– Index: 0.525
– Total population: 18,229
– White: 50.5% (9,197)
– Black or African American: 46.9% (8,553)
– American Indian and Alaska Native: 1.3% (242)
– Asian: 0.0% (6)
– Native Hawaiian and other Pacific Islander: 0.0% (0)
– 2 or more races: 1.0% (174)
– Some other Race: 0.3% (57)
NatalieMaynor // Wikimedia Commons
#12. Panola County
– Index: 0.526
– Total population: 34,190
– White: 48.7% (16,647)
– Black or African American: 48.6% (16,616)
– American Indian and Alaska Native: 0.2% (64)
– Asian: 0.0% (5)
– Native Hawaiian and other Pacific Islander: 0.1% (21)
– 2 or more races: 2.3% (788)
– Some other Race: 0.1% (49)
Magnolia677 // Wikimedia Commons
#11. Marshall County
– Index: 0.526
– Total population: 35,599
– White: 49.5% (17,616)
– Black or African American: 47.8% (17,017)
– American Indian and Alaska Native: 0.1% (26)
– Asian: 0.0% (0)
– Native Hawaiian and other Pacific Islander: 0.0% (0)
– 2 or more races: 0.9% (303)
– Some other Race: 1.8% (637)
You may also like: Where people in Mississippi are moving to most

Larry D. Moore // Wikimedia Commons
#10. Scott County
– Index: 0.526
– Total population: 28,332
– White: 57.2% (16,211)
– Black or African American: 38.1% (10,791)
– American Indian and Alaska Native: 0.4% (123)
– Asian: 0.3% (73)
– Native Hawaiian and other Pacific Islander: 0.0% (0)
– 2 or more races: 0.7% (199)
– Some other Race: 3.3% (935)
Brewri92535 // Wikimedia Commons
#9. Newton County
– Index: 0.527
– Total population: 21,360
– White: 61.4% (13,115)
– Black or African American: 30.5% (6,515)
– American Indian and Alaska Native: 5.3% (1,135)
– Asian: 0.5% (111)
– Native Hawaiian and other Pacific Islander: 0.0% (0)
– 2 or more races: 1.2% (264)
– Some other Race: 1.0% (220)
Scoutandboo // Wikimedia Commons
#8. Madison County
– Index: 0.527
– Total population: 104,562
– White: 57.2% (59,828)
– Black or African American: 38.0% (39,731)
– American Indian and Alaska Native: 0.2% (185)
– Asian: 2.6% (2,699)
– Native Hawaiian and other Pacific Islander: 0.0% (9)
– 2 or more races: 0.8% (857)
– Some other Race: 1.2% (1,253)
Jerrye & Roy Klotz, MD // Wikimedia Commons
#7. Copiah County
– Index: 0.530
– Total population: 28,501
– White: 45.1% (12,849)
– Black or African American: 51.6% (14,698)
– American Indian and Alaska Native: 0.0% (6)
– Asian: 0.4% (108)
– Native Hawaiian and other Pacific Islander: 0.0% (0)
– 2 or more races: 1.4% (391)
– Some other Race: 1.6% (449)
Tony Webster // Wikimedia Commons
#6. Attala County
– Index: 0.532
– Total population: 18,437
– White: 53.8% (9,916)
– Black or African American: 42.3% (7,792)
– American Indian and Alaska Native: 0.1% (25)
– Asian: 0.2% (44)
– Native Hawaiian and other Pacific Islander: 0.0% (0)
– 2 or more races: 1.9% (342)
– Some other Race: 1.7% (318)
You may also like: Highest-earning counties in Mississippi

Mthunter58 // Wikimedia Commons
#5. Oktibbeha County
– Index: 0.533
– Total population: 49,512
– White: 57.4% (28,406)
– Black or African American: 37.0% (18,312)
– American Indian and Alaska Native: 0.1% (55)
– Asian: 3.3% (1,635)
– Native Hawaiian and other Pacific Islander: 0.1% (29)
– 2 or more races: 1.6% (814)
– Some other Race: 0.5% (261)
Cohee // Wikimedia Commons
#4. Chickasaw County
– Index: 0.549
– Total population: 17,193
– White: 50.3% (8,651)
– Black or African American: 44.3% (7,616)
– American Indian and Alaska Native: 0.1% (11)
– Asian: 0.2% (33)
– Native Hawaiian and other Pacific Islander: 0.0% (0)
– 2 or more races: 1.5% (258)
– Some other Race: 3.6% (624)
Marduk // Wikimedia Commons
#3. Leake County
– Index: 0.559
– Total population: 22,792
– White: 51.2% (11,677)
– Black or African American: 41.9% (9,555)
– American Indian and Alaska Native: 5.7% (1,293)
– Asian: 0.5% (117)
– Native Hawaiian and other Pacific Islander: 0.0% (0)
– 2 or more races: 0.5% (103)
– Some other Race: 0.2% (47)
CapCase // Wikimedia Commons
#2. Neshoba County
– Index: 0.568
– Total population: 29,332
– White: 60.0% (17,593)
– Black or African American: 20.9% (6,145)
– American Indian and Alaska Native: 16.7% (4,895)
– Asian: 0.5% (159)
– Native Hawaiian and other Pacific Islander: 0.0% (8)
– 2 or more races: 1.6% (477)
– Some other Race: 0.2% (55)
Thomas R Machnitzki // Wikimedia Commons
#1. Tallahatchie County
– Index: 0.579
– Total population: 14,158
– White: 35.4% (5,013)
– Black or African American: 53.7% (7,599)
– American Indian and Alaska Native: 0.2% (24)
– Asian: 1.4% (198)
– Native Hawaiian and other Pacific Islander: 0.1% (11)
– 2 or more races: 0.4% (63)
– Some other Race: 8.8% (1,250)
You may also like: Highest-rated Class of 2021 football recruits from Mississippi