In which Mississippi counties do people spend most of their paychecks on housing?
Published 6:03 pm Sunday, July 18, 2021
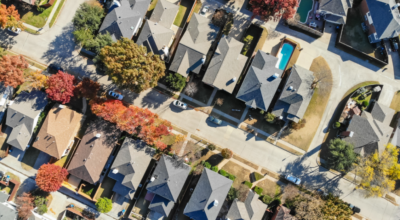
Chillin662 // Wikimedia Commons
Counties in Mississippi where people spend most of their paycheck on housing
It’s no secret that many Americans are forgoing homeownership in favor of renting. In 2020, renters in the U.S. occupied 43 million housing units.
The Stacker team looked at data from a United States Census survey that revealed an estimated 43,378,800 renter-occupied homes in the United States as of 2017, which makes up 36.1% of all households in the country. In 2019, renting was more affordable than buying a median-priced home in 59% of the counties; in 2021, the opposite was true: Owning was more affordable than renting in 63% of U.S. counties.
Stacker compiled a list of counties in Mississippi where people spend the highest percent of income on rent using data from the U.S. Census Bureau. Of course, saving money by owning a home is unattainable for many Americans who don’t have savings that could cover a down payment, those who are denied a mortgage, or both. Keep reading to see where in your home state most of people’s take-home pay goes to their monthly rent.
You may also like: Most popular girl names in the 80s in Mississippi

NatalieMaynor // Wikimedia Commons
#50. Rankin County
– Median percent of income spent on housing: 17.2%
— Percent of households spending <20% of income on housing: 58.3%
— Percent of households spending >30% of income on housing: 19.0%
– Total occupied households: 55,909
– Median household income: $65,996
– Median monthly housing cost: $945
CapCase // Wikimedia Commons
#49. Neshoba County
– Median percent of income spent on housing: 17.3%
— Percent of households spending <20% of income on housing: 52.2%
— Percent of households spending >30% of income on housing: 23.8%
– Total occupied households: 10,657
– Median household income: $37,987
– Median monthly housing cost: $549
Marduk // Wikimedia Commons
#48. Leake County
– Median percent of income spent on housing: 17.4%
— Percent of households spending <20% of income on housing: 52.2%
— Percent of households spending >30% of income on housing: 22.0%
– Total occupied households: 8,105
– Median household income: $37,096
– Median monthly housing cost: $538
Calvin Beale // Wikimedia Commons
#47. Lawrence County
– Median percent of income spent on housing: 17.4%
— Percent of households spending <20% of income on housing: 54.4%
— Percent of households spending >30% of income on housing: 19.0%
– Total occupied households: 4,849
– Median household income: $41,914
– Median monthly housing cost: $608
Brewri92535 // Wikimedia Commons
#46. Newton County
– Median percent of income spent on housing: 17.6%
— Percent of households spending <20% of income on housing: 54.7%
— Percent of households spending >30% of income on housing: 21.2%
– Total occupied households: 8,037
– Median household income: $35,958
– Median monthly housing cost: $526
You may also like: Highest-rated specialty museums in Mississippi, according to Tripadvisor

Gabriel D. May // Wikimedia Commons
#45. Marion County
– Median percent of income spent on housing: 17.7%
— Percent of households spending <20% of income on housing: 50.2%
— Percent of households spending >30% of income on housing: 27.8%
– Total occupied households: 9,483
– Median household income: $32,090
– Median monthly housing cost: $474
Scoutandboo // Wikimedia Commons
#44. Madison County
– Median percent of income spent on housing: 17.8%
— Percent of households spending <20% of income on housing: 53.3%
— Percent of households spending >30% of income on housing: 24.6%
– Total occupied households: 39,635
– Median household income: $71,824
– Median monthly housing cost: $1,064
Catherine Harris // Wikimedia Commons
#43. Tate County
– Median percent of income spent on housing: 17.8%
— Percent of households spending <20% of income on housing: 50.3%
— Percent of households spending >30% of income on housing: 26.0%
– Total occupied households: 10,324
– Median household income: $51,030
– Median monthly housing cost: $756
Natalie Maynor // Wikimedia Commons
#42. Wilkinson County
– Median percent of income spent on housing: 17.8%
— Percent of households spending <20% of income on housing: 49.6%
— Percent of households spending >30% of income on housing: 28.3%
– Total occupied households: 3,170
– Median household income: $27,313
– Median monthly housing cost: $406
Calvin Beale // Wikimedia Commons
#41. Walthall County
– Median percent of income spent on housing: 17.9%
— Percent of households spending <20% of income on housing: 51.1%
— Percent of households spending >30% of income on housing: 27.1%
– Total occupied households: 5,601
– Median household income: $30,961
– Median monthly housing cost: $461
You may also like: Recipes from Mississippi

Rdstephens // Wikimedia Commons
#40. Noxubee County
– Median percent of income spent on housing: 18.0%
— Percent of households spending <20% of income on housing: 45.9%
— Percent of households spending >30% of income on housing: 25.6%
– Total occupied households: 3,986
– Median household income: $33,784
– Median monthly housing cost: $508
Leigh T. Harrell // Wikimedia Commons
#39. Lowndes County
– Median percent of income spent on housing: 18.1%
— Percent of households spending <20% of income on housing: 49.9%
— Percent of households spending >30% of income on housing: 28.3%
– Total occupied households: 22,436
– Median household income: $50,441
– Median monthly housing cost: $759
Cohee // Wikimedia Commons
#38. Lee County
– Median percent of income spent on housing: 18.3%
— Percent of households spending <20% of income on housing: 52.7%
— Percent of households spending >30% of income on housing: 24.9%
– Total occupied households: 32,099
– Median household income: $50,559
– Median monthly housing cost: $770
Woodlot // Wikimedia Commons
#37. Pearl River County
– Median percent of income spent on housing: 18.3%
— Percent of households spending <20% of income on housing: 54.6%
— Percent of households spending >30% of income on housing: 22.9%
– Total occupied households: 21,020
– Median household income: $46,901
– Median monthly housing cost: $716
The diva777 // Wikimedia Commons
#36. Lamar County
– Median percent of income spent on housing: 18.4%
— Percent of households spending <20% of income on housing: 53.7%
— Percent of households spending >30% of income on housing: 23.5%
– Total occupied households: 22,116
– Median household income: $60,328
– Median monthly housing cost: $924
You may also like: Highest-rated Class of 2021 football recruits from Mississippi

Thomas R Machnitzki // Wikimedia Commons
#35. DeSoto County
– Median percent of income spent on housing: 18.6%
— Percent of households spending <20% of income on housing: 55.3%
— Percent of households spending >30% of income on housing: 22.7%
– Total occupied households: 62,890
– Median household income: $67,038
– Median monthly housing cost: $1,040
Dudemanfellabra // Wikimedia Commons
#34. Lauderdale County
– Median percent of income spent on housing: 18.9%
— Percent of households spending <20% of income on housing: 48.3%
— Percent of households spending >30% of income on housing: 27.2%
– Total occupied households: 29,736
– Median household income: $42,534
– Median monthly housing cost: $671
Larry D. Moore // Wikimedia Commons
#33. Scott County
– Median percent of income spent on housing: 19.0%
— Percent of households spending <20% of income on housing: 51.0%
— Percent of households spending >30% of income on housing: 23.9%
– Total occupied households: 10,180
– Median household income: $34,943
– Median monthly housing cost: $553
Thomas R Machnitzki // Wikimedia Commons
#32. Tallahatchie County
– Median percent of income spent on housing: 19.0%
— Percent of households spending <20% of income on housing: 45.5%
— Percent of households spending >30% of income on housing: 26.2%
– Total occupied households: 4,369
– Median household income: $29,864
– Median monthly housing cost: $474
Cohee // Wikimedia Commons
#31. Chickasaw County
– Median percent of income spent on housing: 19.1%
— Percent of households spending <20% of income on housing: 49.3%
— Percent of households spending >30% of income on housing: 24.9%
– Total occupied households: 6,476
– Median household income: $36,548
– Median monthly housing cost: $583
You may also like: Biggest sources of immigrants to Mississippi

Magnolia677 // Wikimedia Commons
#30. Marshall County
– Median percent of income spent on housing: 19.2%
— Percent of households spending <20% of income on housing: 52.7%
— Percent of households spending >30% of income on housing: 25.3%
– Total occupied households: 12,772
– Median household income: $42,233
– Median monthly housing cost: $674
Renelibrary // Wikimedia Commons
#29. Warren County
– Median percent of income spent on housing: 19.3%
— Percent of households spending <20% of income on housing: 48.5%
— Percent of households spending >30% of income on housing: 30.8%
– Total occupied households: 18,235
– Median household income: $45,113
– Median monthly housing cost: $727
Infrogmation of New Orleans // Wikimedia Commons
#28. Hancock County
– Median percent of income spent on housing: 19.4%
— Percent of households spending <20% of income on housing: 50.8%
— Percent of households spending >30% of income on housing: 25.8%
– Total occupied households: 20,036
– Median household income: $48,119
– Median monthly housing cost: $779
NatalieMaynor // Wikimedia Commons
#27. Panola County
– Median percent of income spent on housing: 19.5%
— Percent of households spending <20% of income on housing: 47.4%
— Percent of households spending >30% of income on housing: 25.3%
– Total occupied households: 12,488
– Median household income: $38,304
– Median monthly housing cost: $622
Quentin Melson // Wikimedia Commons
#26. Jackson County
– Median percent of income spent on housing: 19.6%
— Percent of households spending <20% of income on housing: 49.9%
— Percent of households spending >30% of income on housing: 26.3%
– Total occupied households: 52,423
– Median household income: $51,657
– Median monthly housing cost: $843
You may also like: Counties with the most college graduates in Mississippi

Mark Hilton // Wikimedia Commons
#25. Winston County
– Median percent of income spent on housing: 19.6%
— Percent of households spending <20% of income on housing: 49.4%
— Percent of households spending >30% of income on housing: 24.6%
– Total occupied households: 7,269
– Median household income: $34,724
– Median monthly housing cost: $568
Calvin Beale // Wikimedia Commons
#24. Jefferson Davis County
– Median percent of income spent on housing: 19.9%
— Percent of households spending <20% of income on housing: 47.5%
— Percent of households spending >30% of income on housing: 26.7%
– Total occupied households: 4,713
– Median household income: $32,116
– Median monthly housing cost: $533
Mthunter58 // Wikimedia Commons
#23. Jefferson County
– Median percent of income spent on housing: 20.0%
— Percent of households spending <20% of income on housing: 41.3%
— Percent of households spending >30% of income on housing: 22.6%
– Total occupied households: 2,448
– Median household income: $25,019
– Median monthly housing cost: $418
Matthew Nichols // Wikimedia Commons
#22. Grenada County
– Median percent of income spent on housing: 20.1%
— Percent of households spending <20% of income on housing: 48.3%
— Percent of households spending >30% of income on housing: 26.6%
– Total occupied households: 8,391
– Median household income: $40,122
– Median monthly housing cost: $672
Mississippi Department of Archives and History // Wikimedia Commons
#21. Issaquena County
– Median percent of income spent on housing: 20.7%
— Percent of households spending <20% of income on housing: 35.8%
— Percent of households spending >30% of income on housing: 27.5%
– Total occupied households: 483
– Median household income: $24,208
– Median monthly housing cost: $418
You may also like: Where people in Mississippi are moving to most

Natalie Maynor // Wikimedia Commons
#20. Sharkey County
– Median percent of income spent on housing: 21.2%
— Percent of households spending <20% of income on housing: 39.8%
— Percent of households spending >30% of income on housing: 28.6%
– Total occupied households: 1,751
– Median household income: $29,394
– Median monthly housing cost: $519
Infrogmation of New Orleans // Wikimedia Commons
#19. Claiborne County
– Median percent of income spent on housing: 21.5%
— Percent of households spending <20% of income on housing: 47.7%
— Percent of households spending >30% of income on housing: 19.0%
– Total occupied households: 2,908
– Median household income: $29,338
– Median monthly housing cost: $526
Thomas R Machnitzki (thomas@machnitzki.com) // Wikimedia Commons
#18. Quitman County
– Median percent of income spent on housing: 21.5%
— Percent of households spending <20% of income on housing: 42.9%
— Percent of households spending >30% of income on housing: 26.6%
– Total occupied households: 3,027
– Median household income: $25,283
– Median monthly housing cost: $454
Woodlot // Wikimedia Commons
#17. Harrison County
– Median percent of income spent on housing: 21.8%
— Percent of households spending <20% of income on housing: 43.6%
— Percent of households spending >30% of income on housing: 32.9%
– Total occupied households: 78,104
– Median household income: $47,894
– Median monthly housing cost: $869
Chillin662 // Wikimedia Commons
#16. Yazoo County
– Median percent of income spent on housing: 21.9%
— Percent of households spending <20% of income on housing: 42.8%
— Percent of households spending >30% of income on housing: 26.9%
– Total occupied households: 8,542
– Median household income: $33,279
– Median monthly housing cost: $606
You may also like: Highest-rated things to do in Mississippi, according to Tripadvisor

Z28scrambler // Wikimedia Commons
#15. Pike County
– Median percent of income spent on housing: 22.0%
— Percent of households spending <20% of income on housing: 42.4%
— Percent of households spending >30% of income on housing: 30.0%
– Total occupied households: 14,404
– Median household income: $31,784
– Median monthly housing cost: $584
Chris Crookston // Wikimedia Commons
#14. Coahoma County
– Median percent of income spent on housing: 22.3%
— Percent of households spending <20% of income on housing: 43.5%
— Percent of households spending >30% of income on housing: 30.1%
– Total occupied households: 8,782
– Median household income: $29,121
– Median monthly housing cost: $540
Sturmgewehr88 // Wikimedia
#13. Forrest County
– Median percent of income spent on housing: 22.3%
— Percent of households spending <20% of income on housing: 43.6%
— Percent of households spending >30% of income on housing: 33.1%
– Total occupied households: 28,086
– Median household income: $39,840
– Median monthly housing cost: $739
Jerrye & Roy Klotz, MD // Wikimedia Commons
#12. Lafayette County
– Median percent of income spent on housing: 22.5%
— Percent of households spending <20% of income on housing: 44.3%
— Percent of households spending >30% of income on housing: 32.4%
– Total occupied households: 18,721
– Median household income: $50,272
– Median monthly housing cost: $942
Z28scrambler // Wikimedia Commons
#11. Adams County
– Median percent of income spent on housing: 22.5%
— Percent of households spending <20% of income on housing: 42.6%
— Percent of households spending >30% of income on housing: 26.2%
– Total occupied households: 11,237
– Median household income: $29,936
– Median monthly housing cost: $561
You may also like: Most popular girl names in the 70s in Mississippi

Carlcath // Wikimedia Commons
#10. Clay County
– Median percent of income spent on housing: 22.8%
— Percent of households spending <20% of income on housing: 48.3%
— Percent of households spending >30% of income on housing: 27.6%
– Total occupied households: 7,618
– Median household income: $31,833
– Median monthly housing cost: $605
Michlaovic // Wikimedia
#9. Hinds County
– Median percent of income spent on housing: 23.0%
— Percent of households spending <20% of income on housing: 42.3%
— Percent of households spending >30% of income on housing: 32.3%
– Total occupied households: 88,611
– Median household income: $44,625
– Median monthly housing cost: $854
Jerrye & Roy Klotz, MD // Wikimedia Commons
#8. Tunica County
– Median percent of income spent on housing: 23.1%
— Percent of households spending <20% of income on housing: 44.9%
— Percent of households spending >30% of income on housing: 30.4%
– Total occupied households: 3,930
– Median household income: $39,370
– Median monthly housing cost: $757
Mthunter58 // Wikimedia Commons
#7. Oktibbeha County
– Median percent of income spent on housing: 23.1%
— Percent of households spending <20% of income on housing: 44.1%
— Percent of households spending >30% of income on housing: 31.7%
– Total occupied households: 17,798
– Median household income: $40,453
– Median monthly housing cost: $780
Jerrye & Roy Klotz, MD // Wikimedia Commons
#6. Humphreys County
– Median percent of income spent on housing: 23.5%
— Percent of households spending <20% of income on housing: 40.1%
— Percent of households spending >30% of income on housing: 32.8%
– Total occupied households: 3,186
– Median household income: $28,962
– Median monthly housing cost: $567
You may also like: Most popular girl names in the 60s in Mississippi

Hamhari Brown // Wikimedia Commons
#5. Bolivar County
– Median percent of income spent on housing: 24.2%
— Percent of households spending <20% of income on housing: 42.3%
— Percent of households spending >30% of income on housing: 33.0%
– Total occupied households: 12,111
– Median household income: $29,854
– Median monthly housing cost: $602
Jimmy Emerson from Dalton GA // Wikimedia Commons
#4. Sunflower County
– Median percent of income spent on housing: 24.2%
— Percent of households spending <20% of income on housing: 43.5%
— Percent of households spending >30% of income on housing: 32.9%
– Total occupied households: 8,322
– Median household income: $30,838
– Median monthly housing cost: $623
Nicholas Brown // Wikimedia Commons
#3. Washington County
– Median percent of income spent on housing: 25.5%
— Percent of households spending <20% of income on housing: 40.3%
— Percent of households spending >30% of income on housing: 35.3%
– Total occupied households: 17,988
– Median household income: $29,705
– Median monthly housing cost: $630
Jerrye & Roy Klotz, MD // Wikimedia Commons
#2. Leflore County
– Median percent of income spent on housing: 26.3%
— Percent of households spending <20% of income on housing: 36.7%
— Percent of households spending >30% of income on housing: 33.2%
– Total occupied households: 9,962
– Median household income: $26,735
– Median monthly housing cost: $585
Chillin662 // Wikimedia Commons
#1. Holmes County
– Median percent of income spent on housing: 26.7%
— Percent of households spending <20% of income on housing: 35.1%
— Percent of households spending >30% of income on housing: 31.3%
– Total occupied households: 6,188
– Median household income: $21,504
– Median monthly housing cost: $478
You may also like: Counties with the most super commuters in Mississippi