Deep roots: These Mississippi counties have the most born-and-bred residents who never left
Published 6:00 pm Monday, August 9, 2021
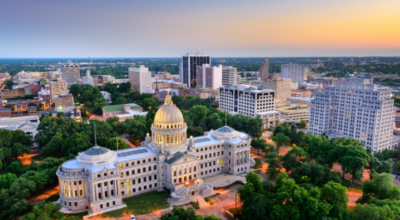
Mississippi Department of Archives and History // Wikimedia Commons
Counties with the most born-and-bred residents in Mississippi
In certain corners of the U.S., the only way you’ll ever be considered a local is if you were born there. Elsewhere, particularly in major metropolitan centers, the constant influx of new businesses, college students, and families can transform neighborhoods every few years and certainly decade over decade.
Americans change their addresses at higher rates than most other countries, but that “move, move, move” mentality may be shifting. In 2016, the U.S. Census Bureau reported that only 11.2% of respondents had moved within the last year. Additionally, 72% of Americans reported living in or close to the city they grew up in. To learn more about where people are staying put, Stacker compiled a list of counties with the most born-and-bred residents in Mississippi using data from the U.S. Census Bureau. Counties are ranked by the highest percentage of residents that were born in the state as of 2019.
Keep reading to discover which counties in your state have the most born-and-bred residents.

Marduk // Wikimedia Commons
#30. Leake County
– Population: 22,792
– Born in Mississippi: 19,271 (84.6% of population)
– Born in another U.S. state or territory: 3,050 (13.4% of population)
— Midwest (3.1%), Northeast (0.3%), South (7.8%), West (1.9%)
– Born in another country: 469 (2.1% of population)
— Africa (0.0%), Asia (0.1%), Europe (0.0%), Latin America (2.0%), North America (0.0%), Oceania (0.0%)
Brewri92535 // Wikimedia Commons
#29. Newton County
– Population: 21,360
– Born in Mississippi: 18,071 (84.6% of population)
– Born in another U.S. state or territory: 2,977 (13.9% of population)
— Midwest (4.1%), Northeast (0.8%), South (8.6%), West (0.4%)
– Born in another country: 259 (1.2% of population)
— Africa (0.0%), Asia (0.3%), Europe (0.0%), Latin America (0.9%), North America (0.0%), Oceania (0.0%)
Calvin Beale // Wikimedia Commons
#28. Wayne County
– Population: 20,373
– Born in Mississippi: 17,241 (84.6% of population)
– Born in another U.S. state or territory: 2,934 (14.4% of population)
— Midwest (1.1%), Northeast (0.3%), South (12.0%), West (0.9%)
– Born in another country: 160 (0.8% of population)
— Africa (0.1%), Asia (0.1%), Europe (0.1%), Latin America (0.5%), North America (0.0%), Oceania (0.0%)
Hamhari Brown // Wikimedia Commons
#27. Bolivar County
– Population: 31,848
– Born in Mississippi: 26,990 (84.7% of population)
– Born in another U.S. state or territory: 4,173 (13.1% of population)
— Midwest (3.0%), Northeast (0.5%), South (8.4%), West (1.2%)
– Born in another country: 632 (2.0% of population)
— Africa (0.0%), Asia (0.6%), Europe (0.2%), Latin America (1.0%), North America (0.0%), Oceania (0.0%)
Cohee // Wikimedia Commons
#26. Chickasaw County
– Population: 17,193
– Born in Mississippi: 14,613 (85.0% of population)
– Born in another U.S. state or territory: 2,196 (12.8% of population)
— Midwest (3.8%), Northeast (0.3%), South (7.4%), West (1.2%)
– Born in another country: 343 (2.0% of population)
— Africa (0.0%), Asia (0.2%), Europe (0.1%), Latin America (1.6%), North America (0.0%), Oceania (0.0%)
NatalieMaynor // Wikimedia Commons
#25. Jasper County
– Population: 16,505
– Born in Mississippi: 14,045 (85.1% of population)
– Born in another U.S. state or territory: 2,410 (14.6% of population)
— Midwest (3.1%), Northeast (0.6%), South (9.3%), West (1.6%)
– Born in another country: 43 (0.3% of population)
— Africa (0.0%), Asia (0.1%), Europe (0.1%), Latin America (0.0%), North America (0.1%), Oceania (0.0%)
Calvin Beale // Wikimedia Commons
#24. Jefferson Davis County
– Population: 11,339
– Born in Mississippi: 9,661 (85.2% of population)
– Born in another U.S. state or territory: 1,583 (14.0% of population)
— Midwest (1.9%), Northeast (0.7%), South (8.3%), West (3.0%)
– Born in another country: 71 (0.6% of population)
— Africa (0.0%), Asia (0.1%), Europe (0.4%), Latin America (0.1%), North America (0.0%), Oceania (0.0%)
Tony Webster // Wikimedia Commons
#23. Attala County
– Population: 18,437
– Born in Mississippi: 15,734 (85.3% of population)
– Born in another U.S. state or territory: 2,478 (13.4% of population)
— Midwest (3.6%), Northeast (0.6%), South (8.7%), West (0.6%)
– Born in another country: 170 (0.9% of population)
— Africa (0.0%), Asia (0.2%), Europe (0.0%), Latin America (0.7%), North America (0.0%), Oceania (0.0%)
NatalieMaynor // Wikimedia Commons
#22. Kemper County
– Population: 9,943
– Born in Mississippi: 8,521 (85.7% of population)
– Born in another U.S. state or territory: 1,412 (14.2% of population)
— Midwest (2.7%), Northeast (0.6%), South (9.2%), West (1.6%)
– Born in another country: 7 (0.1% of population)
— Africa (0.0%), Asia (0.1%), Europe (0.0%), Latin America (0.0%), North America (0.0%), Oceania (0.0%)
Jerrye & Roy Klotz, MD // Wikimedia Commons
#21. Copiah County
– Population: 28,501
– Born in Mississippi: 24,472 (85.9% of population)
– Born in another U.S. state or territory: 3,483 (12.2% of population)
— Midwest (3.4%), Northeast (0.4%), South (6.3%), West (2.0%)
– Born in another country: 462 (1.6% of population)
— Africa (0.0%), Asia (0.4%), Europe (0.1%), Latin America (1.1%), North America (0.0%), Oceania (0.0%)
NatalieMaynor // Wikimedia Commons
#20. Webster County
– Population: 9,768
– Born in Mississippi: 8,414 (86.1% of population)
– Born in another U.S. state or territory: 1,323 (13.5% of population)
— Midwest (3.3%), Northeast (0.2%), South (8.8%), West (1.2%)
– Born in another country: 31 (0.3% of population)
— Africa (0.0%), Asia (0.3%), Europe (0.0%), Latin America (0.0%), North America (0.0%), Oceania (0.0%)
Qqqqqq // Wikimedia Commons
#19. Montgomery County
– Population: 10,068
– Born in Mississippi: 8,700 (86.4% of population)
– Born in another U.S. state or territory: 1,271 (12.6% of population)
— Midwest (3.4%), Northeast (0.6%), South (7.9%), West (0.7%)
– Born in another country: 84 (0.8% of population)
— Africa (0.0%), Asia (0.3%), Europe (0.0%), Latin America (0.5%), North America (0.0%), Oceania (0.0%)
Nlsanfor // Wikimedia Commons
#18. Covington County
– Population: 18,978
– Born in Mississippi: 16,437 (86.6% of population)
– Born in another U.S. state or territory: 2,375 (12.5% of population)
— Midwest (1.3%), Northeast (0.8%), South (9.3%), West (1.1%)
– Born in another country: 115 (0.6% of population)
— Africa (0.0%), Asia (0.0%), Europe (0.1%), Latin America (0.5%), North America (0.0%), Oceania (0.0%)
Nicholas Brown // Wikimedia Commons
#17. Washington County
– Population: 46,057
– Born in Mississippi: 39,956 (86.8% of population)
– Born in another U.S. state or territory: 5,529 (12.0% of population)
— Midwest (3.2%), Northeast (0.5%), South (7.0%), West (1.3%)
– Born in another country: 498 (1.1% of population)
— Africa (0.0%), Asia (0.4%), Europe (0.1%), Latin America (0.5%), North America (0.0%), Oceania (0.0%)
Jerrye & Roy Klotz, MD // Wikimedia Commons
#16. Leflore County
– Population: 29,222
– Born in Mississippi: 25,362 (86.8% of population)
– Born in another U.S. state or territory: 3,206 (11.0% of population)
— Midwest (2.8%), Northeast (0.5%), South (7.2%), West (0.6%)
– Born in another country: 576 (2.0% of population)
— Africa (0.1%), Asia (0.3%), Europe (0.1%), Latin America (1.5%), North America (0.0%), Oceania (0.0%)
Cohee // Wikimedia Commons
#15. Calhoun County
– Population: 14,499
– Born in Mississippi: 12,605 (86.9% of population)
– Born in another U.S. state or territory: 1,412 (9.7% of population)
— Midwest (2.5%), Northeast (0.8%), South (5.4%), West (1.0%)
– Born in another country: 465 (3.2% of population)
— Africa (0.0%), Asia (0.2%), Europe (0.1%), Latin America (2.9%), North America (0.0%), Oceania (0.0%)
Chris Crookston // Wikimedia Commons
#14. Coahoma County
– Population: 23,255
– Born in Mississippi: 20,231 (87.0% of population)
– Born in another U.S. state or territory: 2,892 (12.4% of population)
— Midwest (3.6%), Northeast (0.5%), South (7.7%), West (0.6%)
– Born in another country: 105 (0.5% of population)
— Africa (0.0%), Asia (0.2%), Europe (0.1%), Latin America (0.1%), North America (0.0%), Oceania (0.0%)
Rdstephens // Wikimedia Commons
#13. Noxubee County
– Population: 10,700
– Born in Mississippi: 9,310 (87.0% of population)
– Born in another U.S. state or territory: 1,201 (11.2% of population)
— Midwest (4.4%), Northeast (0.2%), South (5.9%), West (0.8%)
– Born in another country: 125 (1.2% of population)
— Africa (0.5%), Asia (0.0%), Europe (0.0%), Latin America (0.4%), North America (0.2%), Oceania (0.0%)
Z28scrambler // Wikimedia Commons
#12. Franklin County
– Population: 7,733
– Born in Mississippi: 6,746 (87.2% of population)
– Born in another U.S. state or territory: 954 (12.3% of population)
— Midwest (1.6%), Northeast (1.1%), South (9.1%), West (0.5%)
– Born in another country: 29 (0.4% of population)
— Africa (0.0%), Asia (0.3%), Europe (0.1%), Latin America (0.0%), North America (0.0%), Oceania (0.0%)
CapCase // Wikimedia Commons
#11. Neshoba County
– Population: 29,332
– Born in Mississippi: 25,602 (87.3% of population)
– Born in another U.S. state or territory: 3,174 (10.8% of population)
— Midwest (2.4%), Northeast (0.4%), South (6.0%), West (2.0%)
– Born in another country: 425 (1.4% of population)
— Africa (0.0%), Asia (0.3%), Europe (0.1%), Latin America (1.0%), North America (0.0%), Oceania (0.0%)
Thomas R Machnitzki (thomas@machnitzki.com) // Wikimedia Commons
#10. Quitman County
– Population: 7,187
– Born in Mississippi: 6,290 (87.5% of population)
– Born in another U.S. state or territory: 861 (12.0% of population)
— Midwest (3.3%), Northeast (0.3%), South (7.7%), West (0.7%)
– Born in another country: 31 (0.4% of population)
— Africa (0.0%), Asia (0.2%), Europe (0.1%), Latin America (0.2%), North America (0.0%), Oceania (0.0%)
Jimmy Emerson from Dalton GA // Wikimedia Commons
#9. Sunflower County
– Population: 26,168
– Born in Mississippi: 22,978 (87.8% of population)
– Born in another U.S. state or territory: 3,019 (11.5% of population)
— Midwest (3.9%), Northeast (0.4%), South (6.3%), West (0.7%)
– Born in another country: 162 (0.6% of population)
— Africa (0.0%), Asia (0.0%), Europe (0.0%), Latin America (0.6%), North America (0.0%), Oceania (0.0%)
Zeamays // Wikimedia Commons
#8. Carroll County
– Population: 10,070
– Born in Mississippi: 8,865 (88.0% of population)
– Born in another U.S. state or territory: 1,202 (11.9% of population)
— Midwest (3.2%), Northeast (1.0%), South (7.3%), West (0.5%)
– Born in another country: 3 (0.0% of population)
— Africa (0.0%), Asia (0.0%), Europe (0.0%), Latin America (0.0%), North America (0.0%), Oceania (0.0%)
Infrogmation of New Orleans // Wikimedia Commons
#7. Claiborne County
– Population: 9,089
– Born in Mississippi: 8,019 (88.2% of population)
– Born in another U.S. state or territory: 941 (10.4% of population)
— Midwest (4.3%), Northeast (0.9%), South (5.0%), West (0.1%)
– Born in another country: 86 (0.9% of population)
— Africa (0.8%), Asia (0.0%), Europe (0.0%), Latin America (0.1%), North America (0.0%), Oceania (0.0%)
Natalie Maynor // Wikimedia Commons
#6. Smith County
– Population: 16,009
– Born in Mississippi: 14,205 (88.7% of population)
– Born in another U.S. state or territory: 1,614 (10.1% of population)
— Midwest (1.8%), Northeast (0.2%), South (7.0%), West (1.0%)
– Born in another country: 152 (0.9% of population)
— Africa (0.0%), Asia (0.5%), Europe (0.0%), Latin America (0.4%), North America (0.0%), Oceania (0.0%)
Mark Hilton // Wikimedia Commons
#5. Winston County
– Population: 18,229
– Born in Mississippi: 16,189 (88.8% of population)
– Born in another U.S. state or territory: 1,984 (10.9% of population)
— Midwest (2.6%), Northeast (1.0%), South (6.0%), West (1.2%)
– Born in another country: 56 (0.3% of population)
— Africa (0.0%), Asia (0.0%), Europe (0.0%), Latin America (0.3%), North America (0.0%), Oceania (0.0%)
Jerrye & Roy Klotz, MD // Wikimedia Commons
#4. Humphreys County
– Population: 8,389
– Born in Mississippi: 7,636 (91.0% of population)
– Born in another U.S. state or territory: 565 (6.7% of population)
— Midwest (3.0%), Northeast (0.8%), South (2.9%), West (0.0%)
– Born in another country: 188 (2.2% of population)
— Africa (0.0%), Asia (0.0%), Europe (0.1%), Latin America (2.1%), North America (0.0%), Oceania (0.0%)
Natalie Maynor // Wikimedia Commons
#3. Sharkey County
– Population: 4,404
– Born in Mississippi: 4,012 (91.1% of population)
– Born in another U.S. state or territory: 338 (7.7% of population)
— Midwest (1.1%), Northeast (0.0%), South (6.2%), West (0.4%)
– Born in another country: 44 (1.0% of population)
— Africa (0.0%), Asia (0.1%), Europe (0.0%), Latin America (0.0%), North America (0.9%), Oceania (0.0%)
Chillin662 // Wikimedia Commons
#2. Holmes County
– Population: 17,737
– Born in Mississippi: 16,307 (91.9% of population)
– Born in another U.S. state or territory: 1,365 (7.7% of population)
— Midwest (3.8%), Northeast (0.3%), South (3.0%), West (0.6%)
– Born in another country: 20 (0.1% of population)
— Africa (0.0%), Asia (0.1%), Europe (0.0%), Latin America (0.0%), North America (0.0%), Oceania (0.0%)
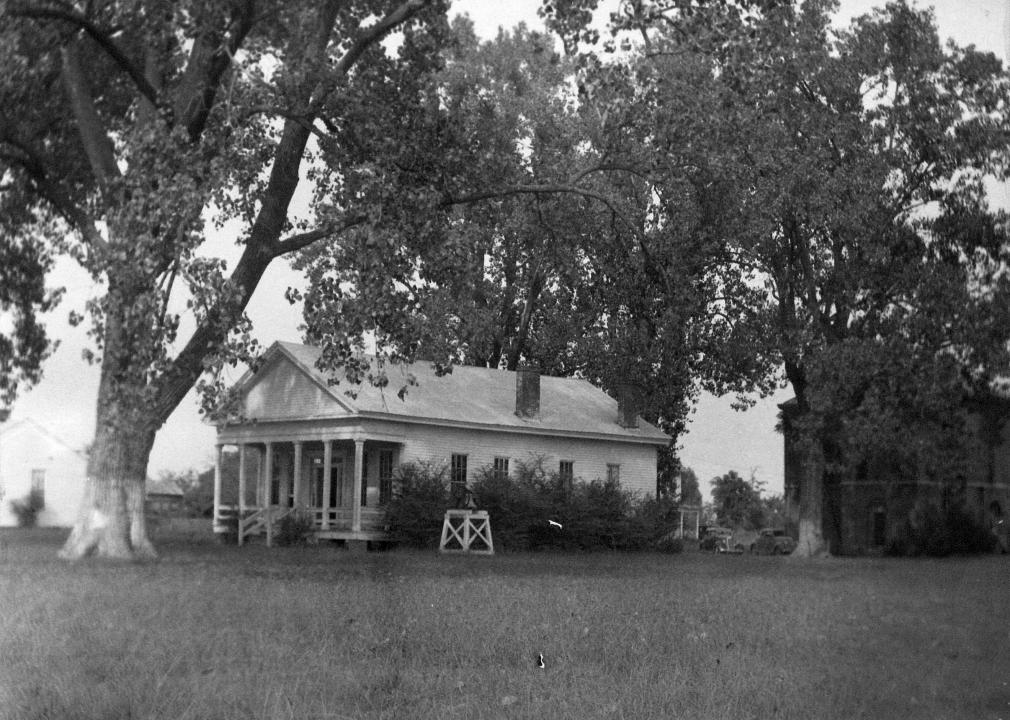
Mississippi Department of Archives and History // Wikimedia Commons
#1. Issaquena County
– Population: 1,361
– Born in Mississippi: 1,272 (93.5% of population)
– Born in another U.S. state or territory: 89 (6.5% of population)
— Midwest (0.1%), Northeast (0.6%), South (5.2%), West (0.6%)
– Born in another country: (0.0% of population)
— Africa (0.0%), Asia (0.0%), Europe (0.0%), Latin America (0.0%), North America (0.0%), Oceania (0.0%)