How the 1918 Spanish flu pandemic hit states across America
Published 2:00 am Saturday, March 12, 2022
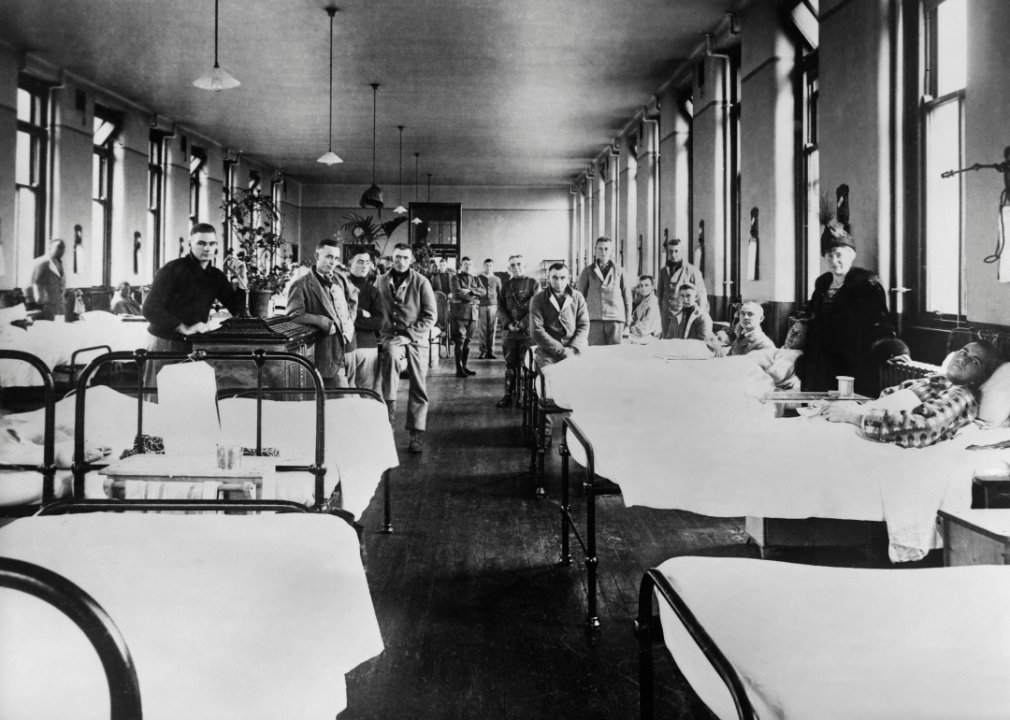
Universal History Archive/Universal Images Group via Getty Images
National: How the 1918 Spanish flu pandemic hit states across America
On March 11, 1918, nearly one year into America’s involvement in World War I, the country reported its first case of a new illness at Camp Funston in Fort Riley, Kansas. This disease, an H1N1 strain of the flu virus, came to be known as the 1918 Spanish flu—a misleading moniker for an illness that neither emerged nor is believed to have originated in Spain.
The movement of war, with thousands of troops crossing oceans and borders, played a primary role in the global spread of the virus. It is estimated that one-third of the world’s population was infected with the 1918 flu, with a global death rate of at least 50 million—more than the military and civilian casualties of the war itself.
And while the war itself was not fought on American soil, it contributed to the spread of the virus from state to state. Including Camp Funston, 24 out of 36 large army training camps across the U.S., housing between 25,000 and 55,000 soldiers, experienced influenza outbreaks, sickening troops and spilling over into the communities where these camps resided.
It is estimated that 675,000 Americans died during the 1918 influenza pandemic, and until September 2021, when COVID-19 deaths surpassed that number, it was the deadliest pandemic in American history in terms of mortality sums. While it is natural to want to compare the severity of these two diseases, particularly within the context of total deaths, it is important to do so with caution. The 1918 flu killed roughly 1 in 150 Americans; COVID-19 kills 1 in 500 Americans, according to the most recent total death data from Johns Hopkins University.
There are, however, undeniable parallels between COVID-19 and the 1918 flu, in both their trajectories and America’s response. Waves of illness, health care staffing shortages, prohibitions of public gatherings, shutdowns of commerce, and mask mandates (and resistance), are all echoes of the 1918 pandemic that we have heard and experienced a century later.
To understand the impact of the 1918 flu in America, Stacker cited National Vital Statistics System mortality data between 1910-1925, digitized by the National Bureau of Economic Research, to look at how states were affected by the 1918 Spanish flu pandemic.
Our chart shows how flu mortality surged due to the prominence of the Spanish flu. Because mortality data does not differentiate between influenza and Spanish flu deaths, average flu deaths before 1918 provide a baseline comparison for how the Spanish flu hit each state.
Where available, 1910-17 averages are used, but due to inconsistencies in annual data across states, flu deaths in 1918-20 are compared to a shorter time frame in certain states and are noted as such. Historic flu mortality data was available for 30 states.
You may also like: History of the supermarket industry in America
![]()

Stacker
California
– Flu mortality as percent of all deaths, 1918: 17.1% (9,675 deaths)
— 40.4 times the 1910-1917 average
– Flu mortality as percent of all deaths, 1919: 8.5% (3,938 deaths)
— 16.4 times the 1910-1917 average
– Flu mortality as percent of all deaths, 1920: 4.6% (2,185 deaths)
— 9.1 times the 1910-1917 average

Stacker
Colorado
– Flu mortality as percent of all deaths, 1918: 23.5% (4,126 deaths)
— 45.0 times the 1910-1917 average
– Flu mortality as percent of all deaths, 1919: 10.0% (1,205 deaths)
— 13.1 times the 1910-1917 average
– Flu mortality as percent of all deaths, 1920: 7.6% (1,049 deaths)
— 11.4 times the 1910-1917 average

Stacker
Connecticut
– Flu mortality as percent of all deaths, 1918: 20.6% (5,604 deaths)
— 21.6 times the 1910-1917 average
– Flu mortality as percent of all deaths, 1919: 6.8% (1,234 deaths)
— 4.8 times the 1910-1917 average
– Flu mortality as percent of all deaths, 1920: 4.9% (918 deaths)
— 3.5 times the 1910-1917 average

Stacker
Illinois
– Flu mortality as percent of all deaths, 1918: 15.1% (15,169 deaths)
— Mortality data before 1918 not available
– Flu mortality as percent of all deaths, 1919: 6.7% (5,195 deaths)
— Mortality data before 1918 not available
– Flu mortality as percent of all deaths, 1920: 6.3% (5,192 deaths)
— Mortality data before 1918 not available

Stacker
Indiana
– Flu mortality as percent of all deaths, 1918: 12.1% (5,553 deaths)
— 10.7 times the 1910-1917 average
– Flu mortality as percent of all deaths, 1919: 8.2% (3,025 deaths)
— 5.8 times the 1910-1917 average
– Flu mortality as percent of all deaths, 1920: 5.8% (2,295 deaths)
— 4.4 times the 1910-1917 average
You may also like: US Navy history from the year you were born

Stacker
Kansas
– Flu mortality as percent of all deaths, 1918: 16.3% (4,073 deaths)
— 8.6 times the 1914-1917 average
– Flu mortality as percent of all deaths, 1919: 9.3% (1,784 deaths)
— 3.8 times the 1914-1917 average
– Flu mortality as percent of all deaths, 1920: 7.3% (1,473 deaths)
— 3.1 times the 1914-1917 average

Stacker
Kentucky
– Flu mortality as percent of all deaths, 1918: 18.1% (7,149 deaths)
— 14.0 times the 1911-1917 average
– Flu mortality as percent of all deaths, 1919: 12.6% (3,862 deaths)
— 7.6 times the 1911-1917 average
– Flu mortality as percent of all deaths, 1920: 6.4% (1,838 deaths)
— 3.6 times the 1911-1917 average

Stacker
Louisiana
– Flu mortality as percent of all deaths, 1918: 16.5% (5,312 deaths)
— Mortality data before 1918 not available
– Flu mortality as percent of all deaths, 1919: 9.3% (2,141 deaths)
— Mortality data before 1918 not available
– Flu mortality as percent of all deaths, 1920: 4.2% (916 deaths)
— Mortality data before 1918 not available

Stacker
Maine
– Flu mortality as percent of all deaths, 1918: 17.3% (2,513 deaths)
— 13.7 times the 1910-1917 average
– Flu mortality as percent of all deaths, 1919: 7.2% (807 deaths)
— 4.4 times the 1910-1917 average
– Flu mortality as percent of all deaths, 1920: 5.0% (591 deaths)
— 3.2 times the 1910-1917 average

Stacker
Maryland
– Flu mortality as percent of all deaths, 1918: 13.8% (4,437 deaths)
— 20.7 times the 1910-1917 average
– Flu mortality as percent of all deaths, 1919: 5.6% (1,232 deaths)
— 5.8 times the 1910-1917 average
– Flu mortality as percent of all deaths, 1920: 3.2% (691 deaths)
— 3.2 times the 1910-1917 average
You may also like: Resilient photos of cities that recovered from war

Stacker
Massachusetts
– Flu mortality as percent of all deaths, 1918: 16.2% (12,494 deaths)
— 32.9 times the 1910-1917 average
– Flu mortality as percent of all deaths, 1919: 5.4% (2,830 deaths)
— 7.5 times the 1910-1917 average
– Flu mortality as percent of all deaths, 1920: 3.0% (1,584 deaths)
— 4.2 times the 1910-1917 average

Stacker
Michigan
– Flu mortality as percent of all deaths, 1918: 12.0% (6,382 deaths)
— 13.1 times the 1910-1917 average
– Flu mortality as percent of all deaths, 1919: 6.6% (3,024 deaths)
— 6.2 times the 1910-1917 average
– Flu mortality as percent of all deaths, 1920: 5.9% (3,018 deaths)
— 6.2 times the 1910-1917 average

Stacker
Minnesota
– Flu mortality as percent of all deaths, 1918: 18.4% (5,720 deaths)
— 30.2 times the 1910-1917 average
– Flu mortality as percent of all deaths, 1919: 8.5% (2,106 deaths)
— 11.1 times the 1910-1917 average
– Flu mortality as percent of all deaths, 1920: 6.5% (1,677 deaths)
— 8.9 times the 1910-1917 average

Stacker
Missouri
– Flu mortality as percent of all deaths, 1918: 13.2% (7,025 deaths)
— 9.8 times the 1911-1917 average
– Flu mortality as percent of all deaths, 1919: 6.6% (2,633 deaths)
— 3.7 times the 1911-1917 average
– Flu mortality as percent of all deaths, 1920: 7.8% (3,310 deaths)
— 4.6 times the 1911-1917 average

Stacker
Montana
– Flu mortality as percent of all deaths, 1918: 29.5% (2,654 deaths)
— 84.9 times the 1910-1917 average
– Flu mortality as percent of all deaths, 1919: 11.9% (687 deaths)
— 22.0 times the 1910-1917 average
– Flu mortality as percent of all deaths, 1920: 5.7% (304 deaths)
— 9.7 times the 1910-1917 average
You may also like: Can you answer these real ‘Jeopardy!’ questions about US military history?

Stacker
New Hampshire
– Flu mortality as percent of all deaths, 1918: 20.9% (1,999 deaths)
— 19.0 times the 1910-1917 average
– Flu mortality as percent of all deaths, 1919: 7.6% (493 deaths)
— 4.7 times the 1910-1917 average
– Flu mortality as percent of all deaths, 1920: 4.5% (303 deaths)
— 2.9 times the 1910-1917 average

Stacker
New Jersey
– Flu mortality as percent of all deaths, 1918: 13.7% (8,377 deaths)
— 25.1 times the 1910-1917 average
– Flu mortality as percent of all deaths, 1919: 5.2% (2,117 deaths)
— 6.3 times the 1910-1917 average
– Flu mortality as percent of all deaths, 1920: 2.9% (1,202 deaths)
— 3.6 times the 1910-1917 average

Stacker
New York
– Flu mortality as percent of all deaths, 1918: 11.5% (21,903 deaths)
— 17.6 times the 1910-1917 average
– Flu mortality as percent of all deaths, 1919: 4.9% (6,944 deaths)
— 5.6 times the 1910-1917 average
– Flu mortality as percent of all deaths, 1920: 3.3% (4,719 deaths)
— 3.8 times the 1910-1917 average

Stacker
North Carolina
– Flu mortality as percent of all deaths, 1918: 18.8% (7,948 deaths)
— 40.7 times the 1910-1917 average
– Flu mortality as percent of all deaths, 1919: 12.3% (3,802 deaths)
— 19.4 times the 1910-1917 average
– Flu mortality as percent of all deaths, 1920: 9.2% (2,995 deaths)
— 15.3 times the 1910-1917 average

Stacker
Ohio
– Flu mortality as percent of all deaths, 1918: 14.7% (13,542 deaths)
— 14.8 times the 1910-1917 average
– Flu mortality as percent of all deaths, 1919: 7.8% (5,668 deaths)
— 6.2 times the 1910-1917 average
– Flu mortality as percent of all deaths, 1920: 5.1% (3,808 deaths)
— 4.2 times the 1910-1917 average
You may also like: History of trucking in America

Stacker
Oregon
– Flu mortality as percent of all deaths, 1918: 16.2% (1,564 deaths)
— Mortality data before 1918 not available
– Flu mortality as percent of all deaths, 1919: 9.5% (849 deaths)
— Mortality data before 1918 not available
– Flu mortality as percent of all deaths, 1920: 5.2% (481 deaths)
— Mortality data before 1918 not available

Stacker
Pennsylvania
– Flu mortality as percent of all deaths, 1918: 20.9% (39,301 deaths)
— 30.1 times the 1910-1917 average
– Flu mortality as percent of all deaths, 1919: 5.9% (6,878 deaths)
— 5.3 times the 1910-1917 average
– Flu mortality as percent of all deaths, 1920: 5.1% (6,114 deaths)
— 4.7 times the 1910-1917 average

Stacker
Rhode Island
– Flu mortality as percent of all deaths, 1918: 17.7% (2,190 deaths)
— 25.6 times the 1910-1917 average
– Flu mortality as percent of all deaths, 1919: 6.7% (568 deaths)
— 6.6 times the 1910-1917 average
– Flu mortality as percent of all deaths, 1920: 4.2% (364 deaths)
— 4.3 times the 1910-1917 average

Stacker
South Carolina
– Flu mortality as percent of all deaths, 1918: 19.4% (5,964 deaths)
— 16.2 times the 1916-1917 average
– Flu mortality as percent of all deaths, 1919: 13.8% (3,171 deaths)
— 8.6 times the 1916-1917 average
– Flu mortality as percent of all deaths, 1920: 9.8% (2,322 deaths)
— 6.3 times the 1916-1917 average

Stacker
Tennessee
– Flu mortality as percent of all deaths, 1918: 16.9% (6,281 deaths)
— 11.1 times 1917 mortality
– Flu mortality as percent of all deaths, 1919: 10.8% (3,093 deaths)
— 5.5 times 1917 mortality
– Flu mortality as percent of all deaths, 1920: 8.5% (2,412 deaths)
— 4.3 times 1917 mortality
You may also like: US Air Force history from the year you were born

Stacker
Utah
– Flu mortality as percent of all deaths, 1918: 22.7% (1,402 deaths)
— 35.1 times the 1910-1915 average
– Flu mortality as percent of all deaths, 1919: 16.4% (803 deaths)
— 20.1 times the 1910-1915 average
– Flu mortality as percent of all deaths, 1920: 11.0% (573 deaths)
— 14.3 times the 1910-1915 average

Stacker
Vermont
– Flu mortality as percent of all deaths, 1918: 19.9% (1,352 deaths)
— 9.5 times the 1910-1913 average
– Flu mortality as percent of all deaths, 1919: 7.2% (366 deaths)
— 2.6 times the 1910-1913 average
– Flu mortality as percent of all deaths, 1920: 5.4% (297 deaths)
— 2.1 times the 1910-1913 average

Stacker
Virginia
– Flu mortality as percent of all deaths, 1918: 19.0% (7,839 deaths)
— 18.2 times 1917 flu mortality
– Flu mortality as percent of all deaths, 1919: 12.3% (3,858 deaths)
— 9.0 times 1917 flu mortality
– Flu mortality as percent of all deaths, 1920: 7.6% (2,311 deaths)
— 5.4 times 1917 flu mortality

Stacker
Washington
– Flu mortality as percent of all deaths, 1918: 17.4% (2,926 deaths)
— 27.6 times the 1910 and 1917 average
– Flu mortality as percent of all deaths, 1919: 9.5% (1,365 deaths)
— 12.9 times the 1910 and 1917 average
– Flu mortality as percent of all deaths, 1920: 7.4% (1,121 deaths)
— 10.6 times the 1910 and 1917 average

Stacker
Wisconsin
– Flu mortality as percent of all deaths, 1918: 17.9% (6,250 deaths)
— 18.3 times the 1910 and 1917 average
– Flu mortality as percent of all deaths, 1919: 7.9% (2,206 deaths)
— 6.5 times the 1910 and 1917 average
– Flu mortality as percent of all deaths, 1920: 5.8% (1,726 deaths)
— 5.1 times the 1910 and 1917 average
You may also like: Cost of gold the year you were born