What data shows about traffic fatalities in 2020
Published 9:00 pm Monday, May 23, 2022
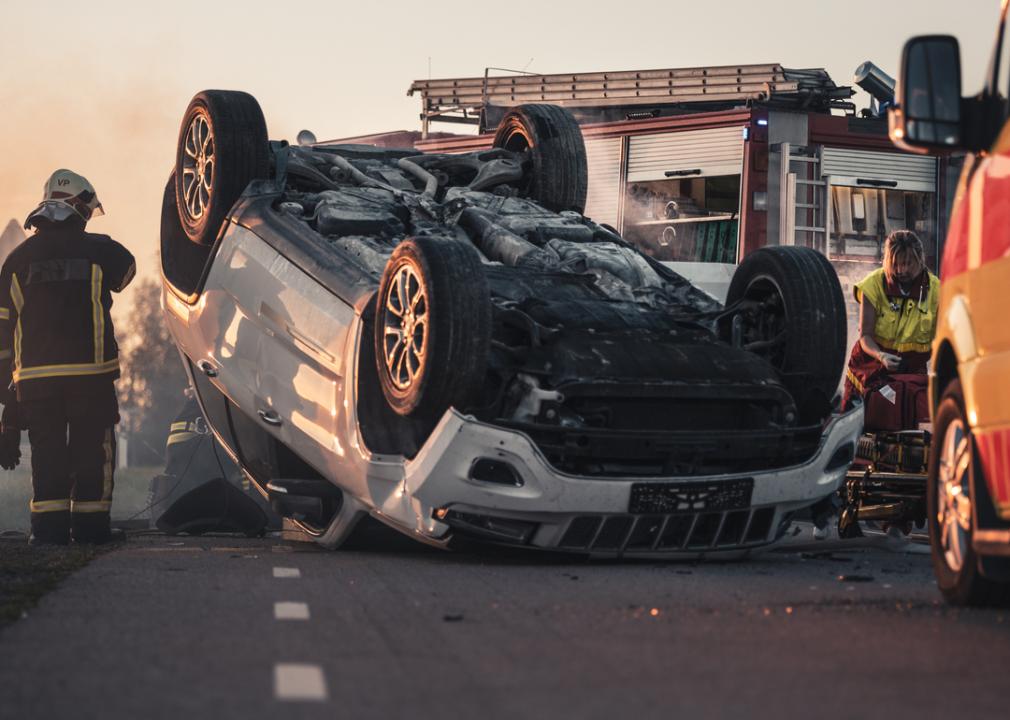
Gorodenkoff // Shutterstock
What data shows about traffic fatalities in 2020
Despite there being fewer people on the road in 2020 due to COVID-19 lockdowns—total vehicle miles traveled decreased by 11%—fatal crashes increased by nearly 7% from 2019. There were 35,766 traffic incidents in the United States resulting in 38,824 deaths.
Forty-five percent of fatal crashes involved drivers who were speeding, impaired by alcohol, or not wearing a seat belt, according to the National Highway Traffic Safety Administration. Across nearly every category, fatalities increased year over year. For example, bicyclist and pedestrian fatalities hit their highest point since the late 1980s. 2020 saw the highest number of deadly motorcycle crashes since tracking began 45 years prior.
To combat this worsening crisis, the U.S. Department of Transportation announced in January 2022 its National Roadway Safety Strategy. The plan leans heavily on technological changes such as requiring all new passenger vehicles to include automatic emergency braking with pedestrian detection, technology that can detect impairment, and automated safety enforcement programs like speed cameras to improve roadway safety and account for human fallibility.
Infrastructure will also be a primary focus. Under President Joe Biden’s Infrastructure Investment and Jobs Act, billions of dollars in grants will be awarded to states and municipalities to bolster physical improvements such as lower speed limits, safer road designs with dedicated bike and bus lanes, better lighting, and safer crosswalks.
To better understand this crisis on America’s roads and the characteristics of fatal traffic incidents, Staver Accident Injury Lawyers, P.C. examined data from the National Highway Traffic Safety Administration’s 2020 Fatality Analysis Reporting System. The 2020 FARS data was released on March 2, 2022.
To be included in this data, a crash must have occurred in the U.S. (including Washington D.C. and Puerto Rico), on a roadway open to the public, and there must be a fatality related to the crash within 30 days of the incident. Crashes can be categorized in multiple groups at once. For example, a crash that involved a driver with alcohol detected in their blood where a vehicle was also speeding would be counted in both categories.
![]()

Canva
Distracted drivers
– Total number of incidents: 2,880 (8% of total)
– Total number of fatalities: 3,142 (8%)
Distracted driving is defined as anything that takes a driver’s attention away from operating the vehicle safely, and includes three subcategories: manual, visual, and cognitive distractions. One of the most common distractions—texting while driving—involves all three. You could drive the length of a football field in the amount of time it takes to read a text. A study conducted by the University of Utah found that impairments associated with using a cellphone while driving can be as severe as those associated with driving with a blood-alcohol level of 0.08%. Among truck drivers and heavy vehicle operators, texting made the risk of a crash 23 times higher than nondistracted driving.

BalanceFormCreative // Shutterstock
Young drivers
– Total number of incidents: 4,405 (12% of total)
– Total number of fatalities: 5,037 (13%)
Young drivers are inexperienced drivers and are more likely to partake in risky behavior behind the wheel, like texting or not wearing a seatbelt as a driver or a passenger. According to the Centers for Disease Control and Prevention, the risk of crashes is higher among teens ages 16–19 than among any other age group. A 2019 survey of teen drivers found nearly 40% texted or emailed while driving at least once within the previous month. Teen drivers are also more likely to speed and less likely to give the appropriate amount of headway between cars. Teen drivers are three times more likely than any other age group, per mile driven, to be in a fatal crash.

Canva
Drivers with alcohol detected in their blood
– Total number of incidents: 7,341 (21% of total)
– Total number of fatalities: 8,163 (21%)
Even a small amount of alcohol is enough to impair driving ability, including thinking, reasoning, and muscle coordination; roughly 16% of drivers in fatal crashes with alcohol detected in their systems fall below the legal blood alcohol content limit of .08. Even with a blood alcohol concentration of just .02, drivers can experience a decline in visual function such as tracking a moving target and have a more difficult time performing two tasks at once. At the legal limit of .08, a driver’s ability to process information, control their speed, and concentrate are impaired. In 2020, half of the drivers in fatal crashes who tested positive for alcohol had BACs at least twice the legal limit. Since the NHTSA began tracking motor vehicle deaths by alcohol involvement in 1982, fatalities have decreased from 48% to 30%.

Canva
Speeding drivers
– Total number of incidents: 10,136 (28% of total)
– Total number of fatalities: 11,258 (29%)
The number of fatalities in speeding-related crashes increased by 17% from 2019. For many drivers, speeding is a common practice. Roughly half of drivers said they exceeded the speed limit by 15 mph on a freeway in the previous 30 days, and over 40% reported driving in excess of 10 miles per hour over the speed limit in residential areas, according to a 2019 national telephone survey conducted by the AAA Foundation for Traffic Safety. Speeding can also mean driving too fast for the road conditions; going the speed limit of 50 miles per hour on a country road under perfect conditions is too fast when roads are wet or icy. Speed was a factor in 21% of fatal crashes on wet roads, and 42% of fatal crashes on roads with ice or frost.

Photo Spirit // Shutterstock
Incidents in rural versus urban regions
Rural
– Total number of incidents: 15,033 (42% of total)
– Total number of fatalities: 16,665 (43%)
Urban
– Total number of incidents: 20,233 (57%)
– Total number of fatalities: 21,650 (56%)
The characteristics of urban and rural roads can vary significantly. While roughly 1 in 5 people in the U.S. live in rural areas, and 30% of the vehicle miles traveled occur in rural areas, roughly half of fatal vehicle crashes happen on rural roads. One explanation is that crashes on these types of roads tend to be more severe than in urban areas, and access to emergency services and medical care is delayed. Drivers more often travel at higher speeds or exceed the speed limit, and a lack of medians or guardrails increases the likelihood of a collision with other vehicles or objects, according to a study by the University of Iowa.
This story originally appeared on Staver Accident Injury Lawyers, P.C.
and was produced and distributed in partnership with Stacker Studio.