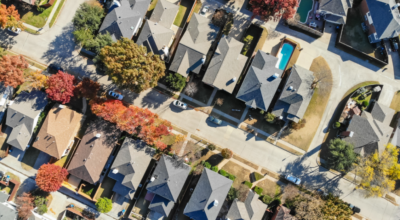
Who tops the list of cities with the most expensive homes in Mississippi? Number one may not be who you think.
Published 12:18 pm Tuesday, June 7, 2022
Volodymyr Kyrylyuk // Shutterstock
Cities with the most expensive homes in Mississippi
Stacker compiled a list of cities with the most expensive homes in Mississippi using data from Zillow. Cities are ranked by the Zillow Home Values Index for all homes as of April 2022. The charts in this story were created automatically using Matplotlib. The most expensive city on the list has a typical home value of $585,891 which is 264% higher than the state average of $161,162.
Metros with the most cities in the top 30 in Mississippi
#1. Gulfport-Biloxi-Pascagoula: 8
#1. Jackson: 8
#3. Memphis: 6
#4. Oxford: 2
#5. Columbus: 1
#5. Greenville: 1
#5. Hattiesburg: 1
#5. Picayune: 1
#5. Starkville: 1
Read on to see which cities made the list.
You may also like: Where people in Mississippi are moving to most
![]()

Stacker
#30. Centreville
– Typical home value: $200,096
– 1-year price change: +5.8%
– 5-year price change: data not available
– Metro area: not in a metro area

Stacker
#29. Diamondhead
– Typical home value: $203,542
– 1-year price change: +13.9%
– 5-year price change: +34.6%
– Metro area: Gulfport-Biloxi-Pascagoula

Stacker
#28. Carriere
– Typical home value: $203,555
– 1-year price change: +11.8%
– 5-year price change: +31.9%
– Metro area: Picayune

Stacker
#27. Long Beach
– Typical home value: $203,592
– 1-year price change: +22.3%
– 5-year price change: +49.4%
– Metro area: Gulfport-Biloxi-Pascagoula

Stacker
#26. Caledonia
– Typical home value: $204,670
– 1-year price change: +10.5%
– 5-year price change: +41.4%
– Metro area: Columbus
You may also like: Mississippi is the #4 state with the most people living near toxic release facilities

Stacker
#25. Biloxi
– Typical home value: $204,833
– 1-year price change: +20.4%
– 5-year price change: +46.8%
– Metro area: Gulfport-Biloxi-Pascagoula

Stacker
#24. Taylor
– Typical home value: $207,444
– 1-year price change: +10.5%
– 5-year price change: +27.4%
– Metro area: Oxford

Stacker
#23. Walls
– Typical home value: $211,811
– 1-year price change: +24.4%
– 5-year price change: +68.1%
– Metro area: Memphis

Stacker
#22. Gulf Hills
– Typical home value: $212,041
– 1-year price change: +22.0%
– 5-year price change: +50.3%
– Metro area: Gulfport-Biloxi-Pascagoula

Stacker
#21. Sumrall
– Typical home value: $212,605
– 1-year price change: +11.8%
– 5-year price change: +34.0%
– Metro area: Hattiesburg
You may also like: Highest NFL draft picks from Mississippi

Stacker
#20. Clinton
– Typical home value: $215,193
– 1-year price change: +19.1%
– 5-year price change: +39.1%
– Metro area: Jackson

Stacker
#19. Starkville
– Typical home value: $216,281
– 1-year price change: +12.3%
– 5-year price change: +22.3%
– Metro area: Starkville

Stacker
#18. Florence
– Typical home value: $216,312
– 1-year price change: +16.2%
– 5-year price change: +37.3%
– Metro area: Jackson

Stacker
#17. Flora
– Typical home value: $216,330
– 1-year price change: +7.7%
– 5-year price change: +27.1%
– Metro area: Jackson

Stacker
#16. Saucier
– Typical home value: $217,771
– 1-year price change: +23.0%
– 5-year price change: +42.6%
– Metro area: Gulfport-Biloxi-Pascagoula
You may also like: Mississippi is the #1 slowest warming state since 1970

Stacker
#15. Terry
– Typical home value: $221,791
– 1-year price change: +16.9%
– 5-year price change: +38.2%
– Metro area: Jackson

Stacker
#14. Ocean Springs
– Typical home value: $241,925
– 1-year price change: +22.2%
– 5-year price change: +56.7%
– Metro area: Gulfport-Biloxi-Pascagoula

Stacker
#13. Lynchburg
– Typical home value: $243,327
– 1-year price change: +27.1%
– 5-year price change: +78.2%
– Metro area: Memphis

Stacker
#12. Ridgeland
– Typical home value: $243,775
– 1-year price change: +15.0%
– 5-year price change: +30.8%
– Metro area: Jackson

Stacker
#11. Oxford
– Typical home value: $245,659
– 1-year price change: +11.3%
– 5-year price change: +32.7%
– Metro area: Oxford
You may also like: Mississippi is the #10 state where food stamps are used the most

Stacker
#10. Vancleave
– Typical home value: $250,797
– 1-year price change: +19.9%
– 5-year price change: +49.2%
– Metro area: Gulfport-Biloxi-Pascagoula

Stacker
#9. Southaven
– Typical home value: $253,724
– 1-year price change: +25.6%
– 5-year price change: +72.5%
– Metro area: Memphis

Stacker
#8. Brandon
– Typical home value: $257,066
– 1-year price change: +18.2%
– 5-year price change: +38.8%
– Metro area: Jackson

Stacker
#7. Pass Christian
– Typical home value: $280,854
– 1-year price change: +24.6%
– 5-year price change: +51.3%
– Metro area: Gulfport-Biloxi-Pascagoula

Stacker
#6. Flowood
– Typical home value: $281,057
– 1-year price change: +18.7%
– 5-year price change: +38.1%
– Metro area: Jackson
You may also like: Counties with highest COVID-19 infection rates in Mississippi

Stacker
#5. Olive Branch
– Typical home value: $323,976
– 1-year price change: +24.0%
– 5-year price change: +64.5%
– Metro area: Memphis

Stacker
#4. Hernando
– Typical home value: $324,082
– 1-year price change: +20.6%
– 5-year price change: +58.1%
– Metro area: Memphis

Stacker
#3. Nesbit
– Typical home value: $336,995
– 1-year price change: +21.5%
– 5-year price change: +55.0%
– Metro area: Memphis

Stacker
#2. Madison
– Typical home value: $344,837
– 1-year price change: +15.7%
– 5-year price change: +28.8%
– Metro area: Jackson

Stacker
#1. Greenville
– Typical home value: $585,891
– 1-year price change: +14.4%
– 5-year price change: +68.3%
– Metro area: Greenville
You may also like: Biggest sources of immigrants to Mississippi


