Here are the Mississippi counties with the highest unemployment rate in the state. Where does your county rank?
Published 9:21 am Friday, July 8, 2022
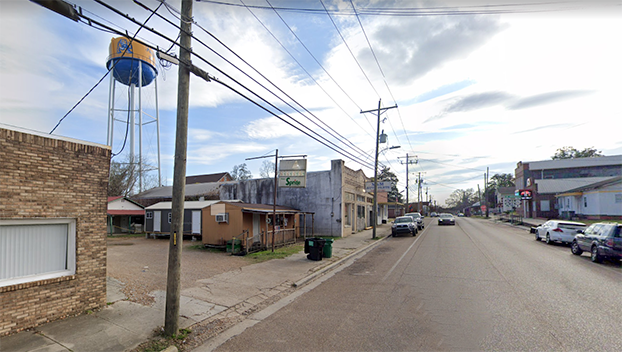
M Floyd // Flickr
Counties with the highest unemployment rate in Mississippi
Unemployment rates, while significantly lower than the alarming pandemic peak of 14.7% experienced in April 2020, remain a subject of concern, notably as economic experts bandy around the idea of a potential recession by 2023. The last economic recession—the Great Recession of 2008-2010—sent rates up to 10% as of October 2009. It was not until the spring of 2019 that unemployment finally went down to the same level it sits at now.
As of May of this year, national unemployment is at 3.6%—as it was in both March and April, marking a three-month stagnation—following a steady drop since that aforementioned COVID-affected peak. Seasonally adjusted unemployment rates by state demonstrate a rather sizable spectrum, ranging from just 1.9% in Nebraska, to 5.1% in New Mexico and 5.7% in the District of Columbia. Further breakdown by the U.S. Bureau of Labor Statistics shows yet another county-based spectrum within each state.
To that end, Stacker compiled a list of counties with the highest unemployment rate in Mississippi using data from the BLS. Counties are ranked by unemployment rate in May 2022, which as of this writing is the most current Bureau data.
![]()
csmith/dbb1 // Wikimedia Commons
#50. Hancock County
– Current unemployment rate: 3.8%
— 1 month change: +0.1%
— 1 year change: -2.5%
– Total labor force: 19,421 (730 unemployed)

Wayne James // Shutterstock
#49. Lauderdale County
– Current unemployment rate: 3.8%
— 1 month change: +0.1%
— 1 year change: -2.0%
– Total labor force: 28,827 (1109 unemployed)
CapCase // Wikimedia Commons
#48. Neshoba County
– Current unemployment rate: 3.8%
— 1 month change: 0.0%
— 1 year change: -1.8%
– Total labor force: 10,274 (390 unemployed)
Mthunter58 // Wikimedia Commons
#47. Oktibbeha County
– Current unemployment rate: 3.8%
— 1 month change: +0.3%
— 1 year change: -2.2%
– Total labor force: 22,741 (854 unemployed)
Brandonrush // Wikimedia Commons
#46. Stone County
– Current unemployment rate: 3.8%
— 1 month change: +0.2%
— 1 year change: -1.8%
– Total labor force: 7,090 (270 unemployed)
Tony Webster // Wikimedia Commons
#45. Attala County
– Current unemployment rate: 3.9%
— 1 month change: +0.1%
— 1 year change: -2.5%
– Total labor force: 7,167 (282 unemployed)
doug_wertman // Wikimedia Commons
#44. Carroll County
– Current unemployment rate: 3.9%
— 1 month change: 0.0%
— 1 year change: -2.2%
– Total labor force: 3,625 (141 unemployed)
Bubba73 // Wikimedia Commons
#43. Jones County
– Current unemployment rate: 3.9%
— 1 month change: +0.2%
— 1 year change: -2.0%
– Total labor force: 24,602 (957 unemployed)
Bobak Ha’Eri // Wikimedia Commons
#42. Chickasaw County
– Current unemployment rate: 4.0%
— 1 month change: +0.2%
— 1 year change: -2.7%
– Total labor force: 6,961 (275 unemployed)
Altairisfar // Wikimedia Commons
#41. Lowndes County
– Current unemployment rate: 4.0%
— 1 month change: +0.3%
— 1 year change: -2.4%
– Total labor force: 25,469 (1014 unemployed)

Chris Pruitt // wikicommons
#40. Montgomery County
– Current unemployment rate: 4.1%
— 1 month change: +0.1%
— 1 year change: -2.3%
– Total labor force: 3,996 (163 unemployed)
Thomas R Machnitzki // Wikimedia Commons
#39. Tallahatchie County
– Current unemployment rate: 4.1%
— 1 month change: +0.2%
— 1 year change: -1.9%
– Total labor force: 4,833 (197 unemployed)

Michlaovic // Wikimedia
#38. Hinds County
– Current unemployment rate: 4.2%
— 1 month change: +0.3%
— 1 year change: -2.5%
– Total labor force: 100,121 (4199 unemployed)
Springfieldohio // Wikimedia Commons
#37. Jackson County
– Current unemployment rate: 4.2%
— 1 month change: +0.2%
— 1 year change: -2.1%
– Total labor force: 59,405 (2477 unemployed)
Canva
#36. Warren County
– Current unemployment rate: 4.3%
— 1 month change: +0.3%
— 1 year change: -2.2%
– Total labor force: 19,416 (836 unemployed)
Canva
#35. Winston County
– Current unemployment rate: 4.3%
— 1 month change: +0.1%
— 1 year change: -2.4%
– Total labor force: 7,179 (311 unemployed)
Jerrye & Roy Klotz, MD // Wikimedia Commons
#34. Copiah County
– Current unemployment rate: 4.4%
— 1 month change: +0.2%
— 1 year change: -2.6%
– Total labor force: 10,688 (473 unemployed)
Brandonrush // Wikimedia Commons
#33. Benton County
– Current unemployment rate: 4.5%
— 1 month change: +0.2%
— 1 year change: -2.9%
– Total labor force: 3,091 (138 unemployed)
Canva
#32. Lawrence County
– Current unemployment rate: 4.5%
— 1 month change: 0.0%
— 1 year change: -2.7%
– Total labor force: 4,730 (214 unemployed)
Canva
#31. Perry County
– Current unemployment rate: 4.5%
— 1 month change: +0.3%
— 1 year change: -2.3%
– Total labor force: 4,266 (192 unemployed)
Hamhari Brown // Wikimedia Commons
#30. Bolivar County
– Current unemployment rate: 4.6%
— 1 month change: +0.3%
— 1 year change: -3.4%
– Total labor force: 11,644 (539 unemployed)
JNix // Shutterstock
#29. Clay County
– Current unemployment rate: 4.6%
— 1 month change: +0.2%
— 1 year change: -3.0%
– Total labor force: 8,418 (390 unemployed)
Rudi Weikard // Wikimedia Commons
#28. Franklin County
– Current unemployment rate: 4.6%
— 1 month change: 0.0%
— 1 year change: -2.3%
– Total labor force: 2,691 (125 unemployed)
Canva
#27. Wayne County
– Current unemployment rate: 4.6%
— 1 month change: 0.0%
— 1 year change: -2.2%
– Total labor force: 7,615 (349 unemployed)
Mac H. Alford // Wikimedia Commons
#26. Amite County
– Current unemployment rate: 4.7%
— 1 month change: 0.0%
— 1 year change: -2.9%
– Total labor force: 4,474 (209 unemployed)
Altairisfar // Wikimedia Commons
#25. Clarke County
– Current unemployment rate: 4.7%
— 1 month change: +0.1%
— 1 year change: -1.9%
– Total labor force: 5,700 (270 unemployed)
Canva
#24. Jasper County
– Current unemployment rate: 4.7%
— 1 month change: -0.1%
— 1 year change: -2.6%
– Total labor force: 5,799 (275 unemployed)
NatalieMaynor // Wikimedia Commons
#23. Panola County
– Current unemployment rate: 4.7%
— 1 month change: +0.1%
— 1 year change: -3.1%
– Total labor force: 12,674 (597 unemployed)
Calvin Beale // Wikimedia Commons
#22. Walthall County
– Current unemployment rate: 4.7%
— 1 month change: +0.3%
— 1 year change: -2.1%
– Total labor force: 4,982 (232 unemployed)
Kreeder13 // Wikimedia Commons
#21. Pike County
– Current unemployment rate: 4.8%
— 1 month change: +0.3%
— 1 year change: -2.6%
– Total labor force: 14,501 (698 unemployed)
Chillin662 // Wikimedia Commons
#20. Yazoo County
– Current unemployment rate: 4.9%
— 1 month change: +0.2%
— 1 year change: -2.9%
– Total labor force: 8,975 (440 unemployed)
dmtilley // Wikimedia Commons
#19. George County
– Current unemployment rate: 5.1%
— 1 month change: +0.3%
— 1 year change: -1.7%
– Total labor force: 8,870 (455 unemployed)
Jerrye & Roy Klotz, MD // Wikimedia Commons
#18. Tunica County
– Current unemployment rate: 5.3%
— 1 month change: +0.3%
— 1 year change: -4.6%
– Total labor force: 4,329 (228 unemployed)
Calvin Beale // Wikimedia Commons
#17. Jefferson Davis County
– Current unemployment rate: 5.4%
— 1 month change: +0.3%
— 1 year change: -2.8%
– Total labor force: 3,883 (208 unemployed)
Jerrye & Roy Klotz, MD // Wikimedia Commons
#16. Leflore County
– Current unemployment rate: 5.4%
— 1 month change: +0.3%
— 1 year change: -3.7%
– Total labor force: 10,205 (552 unemployed)
Bdearthco // Wikimedia Commons
#15. Adams County
– Current unemployment rate: 5.5%
— 1 month change: +0.1%
— 1 year change: -3.2%
– Total labor force: 10,591 (584 unemployed)
Rivers Langley; SaveRivers // Wikimedia Commons
#14. Quitman County
– Current unemployment rate: 5.6%
— 1 month change: +0.7%
— 1 year change: -3.5%
– Total labor force: 2,446 (138 unemployed)
Idawriter // Wikimedia Commons
#13. Washington County
– Current unemployment rate: 5.6%
— 1 month change: +0.1%
— 1 year change: -3.2%
– Total labor force: 15,799 (889 unemployed)
NatalieMaynor // Wikimedia Commons
#12. Kemper County
– Current unemployment rate: 5.7%
— 1 month change: +0.6%
— 1 year change: -2.1%
– Total labor force: 3,324 (190 unemployed)
Natalie Maynor // Wikimedia Commons
#11. Sharkey County
– Current unemployment rate: 5.8%
— 1 month change: +0.2%
— 1 year change: -3.8%
– Total labor force: 1,459 (84 unemployed)
Chris Crookston // Wikimedia Commons
#10. Coahoma County
– Current unemployment rate: 5.9%
— 1 month change: +0.4%
— 1 year change: -3.5%
– Total labor force: 8,012 (471 unemployed)
Jimmy Emerson from Dalton GA // Wikimedia Commons
#9. Sunflower County
– Current unemployment rate: 6.0%
— 1 month change: +0.3%
— 1 year change: -3.9%
– Total labor force: 7,754 (467 unemployed)
Canva
#8. Greene County
– Current unemployment rate: 6.3%
— 1 month change: +0.8%
— 1 year change: -0.7%
– Total labor force: 4,297 (271 unemployed)
Rdstephens // Wikimedia Commons
#7. Noxubee County
– Current unemployment rate: 6.3%
— 1 month change: +0.4%
— 1 year change: -2.9%
– Total labor force: 3,646 (228 unemployed)
Mississippi Department of Archives and History // Wikimedia Commons
#6. Issaquena County
– Current unemployment rate: 7.2%
— 1 month change: -0.4%
— 1 year change: -2.8%
– Total labor force: 349 (25 unemployed)
Georgia Guercio // Wikimedia Commons
#5. Holmes County
– Current unemployment rate: 7.3%
— 1 month change: +0.5%
— 1 year change: -4.3%
– Total labor force: 5,106 (371 unemployed)
S B Calvert Clariosophic // Wikimedia Commons
#4. Wilkinson County
– Current unemployment rate: 7.5%
— 1 month change: +0.6%
— 1 year change: -4.8%
– Total labor force: 2,638 (197 unemployed)
Jerrye & Roy Klotz, MD // Wikimedia Commons
#3. Humphreys County
– Current unemployment rate: 8.0%
— 1 month change: 0.0%
— 1 year change: -5.3%
– Total labor force: 2,072 (165 unemployed)
Infrogmation of New Orleans // Wikimedia Commons
#2. Claiborne County
– Current unemployment rate: 8.6%
— 1 month change: +0.8%
— 1 year change: -3.9%
– Total labor force: 2,962 (255 unemployed)
#1. Jefferson County
– Current unemployment rate: 13.8%
— 1 month change: +1.7%
— 1 year change: -3.9%
– Total labor force: 1,938 (268 unemployed)


