State-by-state prevalence of the 5 most common types of cancer
Published 5:54 pm Friday, July 8, 2022
Canva
State-by-state prevalence of the 5 most common types of cancer
In his 2010 book, “The Emperor of Maladies,” Siddhartha Mukherjee called cancer “not one disease but many diseases” sharing a “fundamental feature: the abnormal growth of cells.” What was at one point in history (not so far removed from our own), a “whispered-about illness” has become the target of a global effort to thwart its onset.
Certain forms of cancer are more common than others, notably in late-stage development. Stacker analyzed cancer incidence data from the National Cancer Institute and CDC to look at where the five most common forms of cancer are most prevalent.
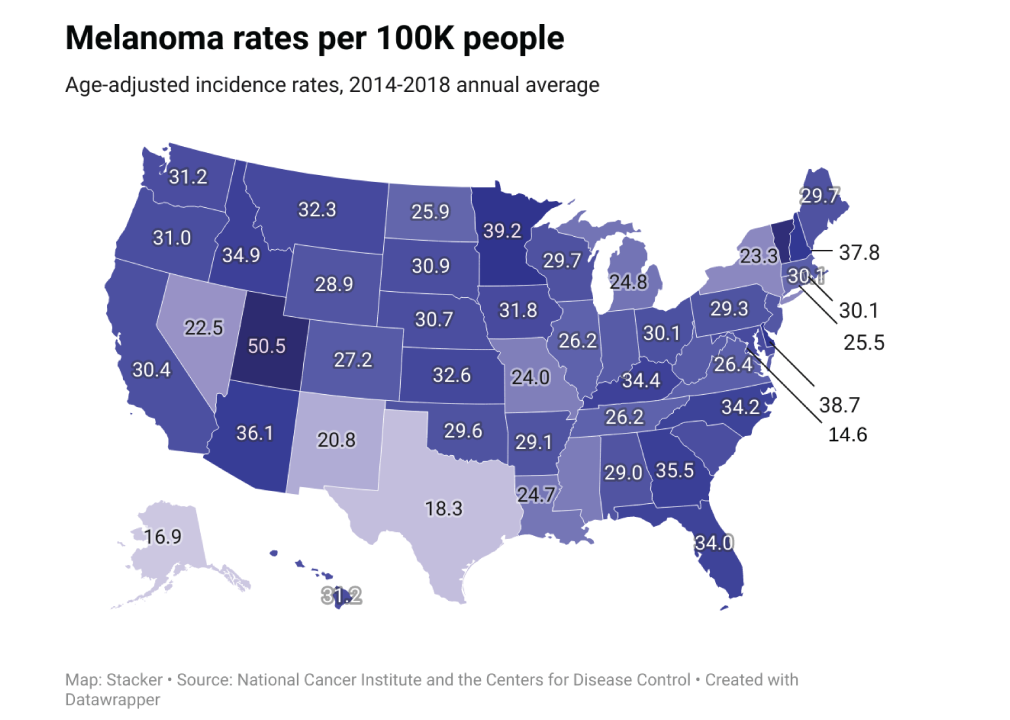
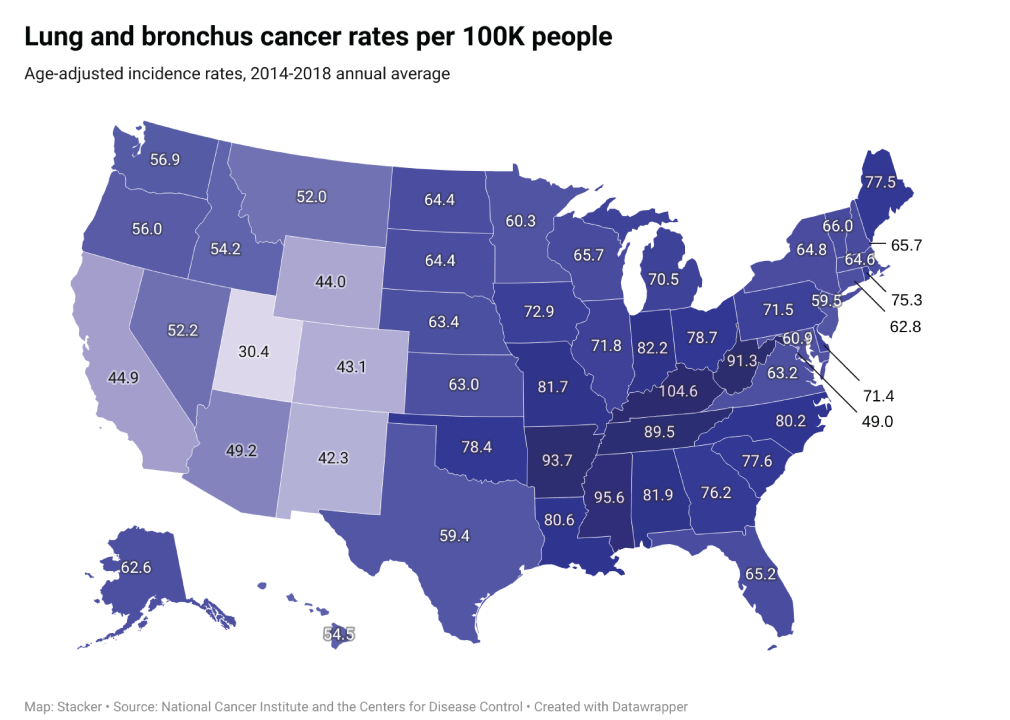
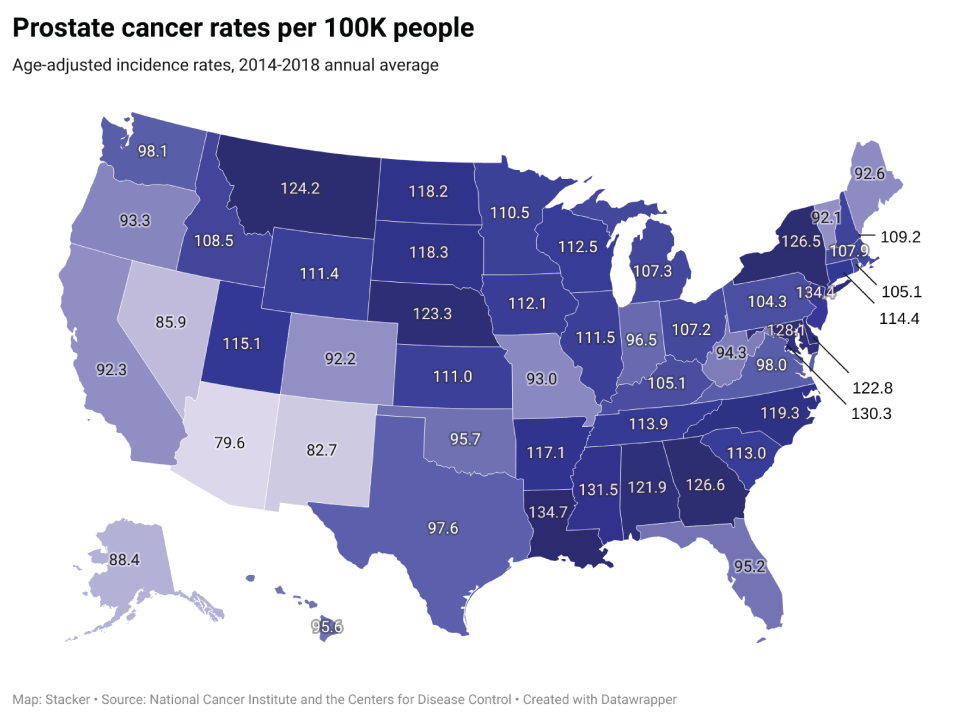
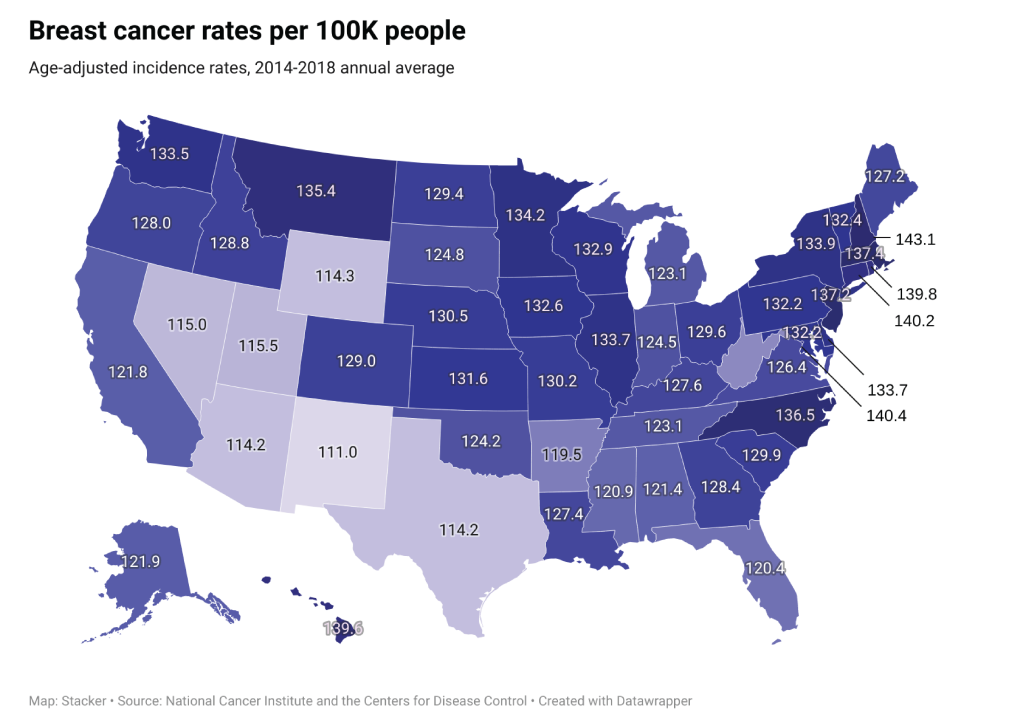
The annual averages in each slide are calculated from data compiled between 2014 and 2018, and have been adjusted for patient age. The data was adjusted to account for the increased likelihood of older people developing cancer, and the state-by-state maps reflect the rates of each type of cancer per 100,000 people.
The following list is derived from the National Institutes of Health’s 2022 projection estimates for the most commonly diagnosed cancers in the U.S., though the projection totals themselves are not included as a data point; a direct comparison would be misleading because this dataset uses compiled and age-adjusted historical data.
Cancer incidence, survival, and mortality rates are population-based indicators of progress against cancer. The mortality-to-incidence ratio can be broadly defined as the percentage of death certificates that include the person’s cancer diagnosis and specify the type of cancer. However, the mortality-to-incidence ratio should not necessarily be interpreted as the survival rate. A cancer diagnosis on a death certificate could have happened at any point in the past and does not necessarily mean the person died of cancer.
Stacker also looked at risk factors for these common cancers, ways to reduce risk, and methods for cancer screening.
You may also like: States with the highest cancer rates
![]()

Stacker
Melanoma
– Average national incidences per year: 49,438
– Percent of incidences in late-stage: 15.0%
– Average annual mortality count: 5,428
— Mortality-to-incidence ratio: 11.0%
The word melanoma means “black tumor.” Its development begins in melanocytes—the cells that produce the pigment melanin. Most people think of melanoma as a type of skin cancer, because it can form in moles on the skin. But it can also form in other pigmented tissues, such as those in the eye or intestine.
Melanoma is less common than other types of skin cancer, but it is more likely than other types of skin cancer to grow and metastasize, or spread to other organs. The most common risk factors for melanoma include exposure to ultraviolet light, having many moles or freckles, having lighter hair, and having a family or personal history of melanoma. The use of tanning beds and sun lamps also increases melanoma risk.
The best ways to prevent melanoma are using sunscreen, wearing sun protective clothing and sunglasses, and seeking shade during midday, when the sun is at its strongest.

Stacker
Colorectal cancer
– Average national incidences per year: 75,374
– Percent of incidences in late-stage: 57.4%
– Average annual mortality count: 27,717
— Mortality-to-incidence ratio: 36.8%
Colorectal cancer develops as malignant cells grow and accumulate in the colon rectum, and usually present as a growth called a polyp. Risk factors for colorectal cancer include smoking, obesity, age, and family history.
Physical activity, combination hormone replacement therapy, and aspirin reduce the risk of colon cancer. Procedures such as colonoscopy and sigmoidoscopy can find polyps, so the doctor can remove them before they become cancerous. The recommended age for men to begin regular colonoscopies, once 50, is now 45. Fecal occult blood tests screen for blood hidden in the stool, which may be a sign of colorectal cancer.

Stacker
Lung and bronchus cancer
– Average national incidences per year: 115,218
– Percent of incidences in late-stage: 70.4%
– Average annual mortality count: 78,841
— Mortality-to-incidence ratio: 68.4%
Lung cancer is the third most common kind of cancer in the U.S., according to the NIH, and the leading cause of cancer death in both men and women. Smoking and exposure to secondhand smoke are the most common risk factors associated with lung cancer. Although most cases of lung cancer are caused by smoking, nonsmokers can get lung cancer, too.
There are two types of lung cancer: small cell lung cancer and non-small cell lung cancer. The bronchi, the two tubes that lead from the trachea to the lungs, are sometimes also involved in lung cancer. Screening tests for lung cancer are in clinical trials, though LDCT scans have been shown to decrease the risk of death in heavy smokers.

Stacker
Prostate cancer
– Average national incidences per year: 200,677
– Percent of incidences in late-stage: 20.6%
– Average annual mortality count: 30,566
— Mortality-to-incidence ratio: 15.2%
Prostate cancer is the second most common cancer among men in the U.S. One in eight men in the U.S. will be diagnosed with this type of cancer. The biggest risk factors for prostate cancer are age, race, and family history. It is more common in men over 50, and in Black men compared to white men. Most men diagnosed with prostate cancer do not die of it, because the majority of prostate cancers grow and spread slowly.

Stacker
Breast cancer
– Average national incidences per year: 249,261
– Percent of incidences in late-stage: 31.9%
– Average annual mortality count: 41,951
— Mortality-to-incidence ratio: 16.8%
Breast cancer is the second most common type of cancer in women in the U.S. It is the second leading cause of cancer death in women, after lung cancer. Older age, a family or personal history of breast cancer, dense breast tissue, obesity, and the use of hormone replacement therapy for the treatment of menopausal symptoms can increase the risk of breast cancer.
Mammography can detect tumors in the breast, even before they have spread to other organs. Mammograms are recommended for women ages 45-54 yearly, and every two years thereafter, except in cases of higher risk factors.
You may also like: 25 facts about food allergies


