The best liberal places to live in America
Published 10:00 pm Monday, November 21, 2022
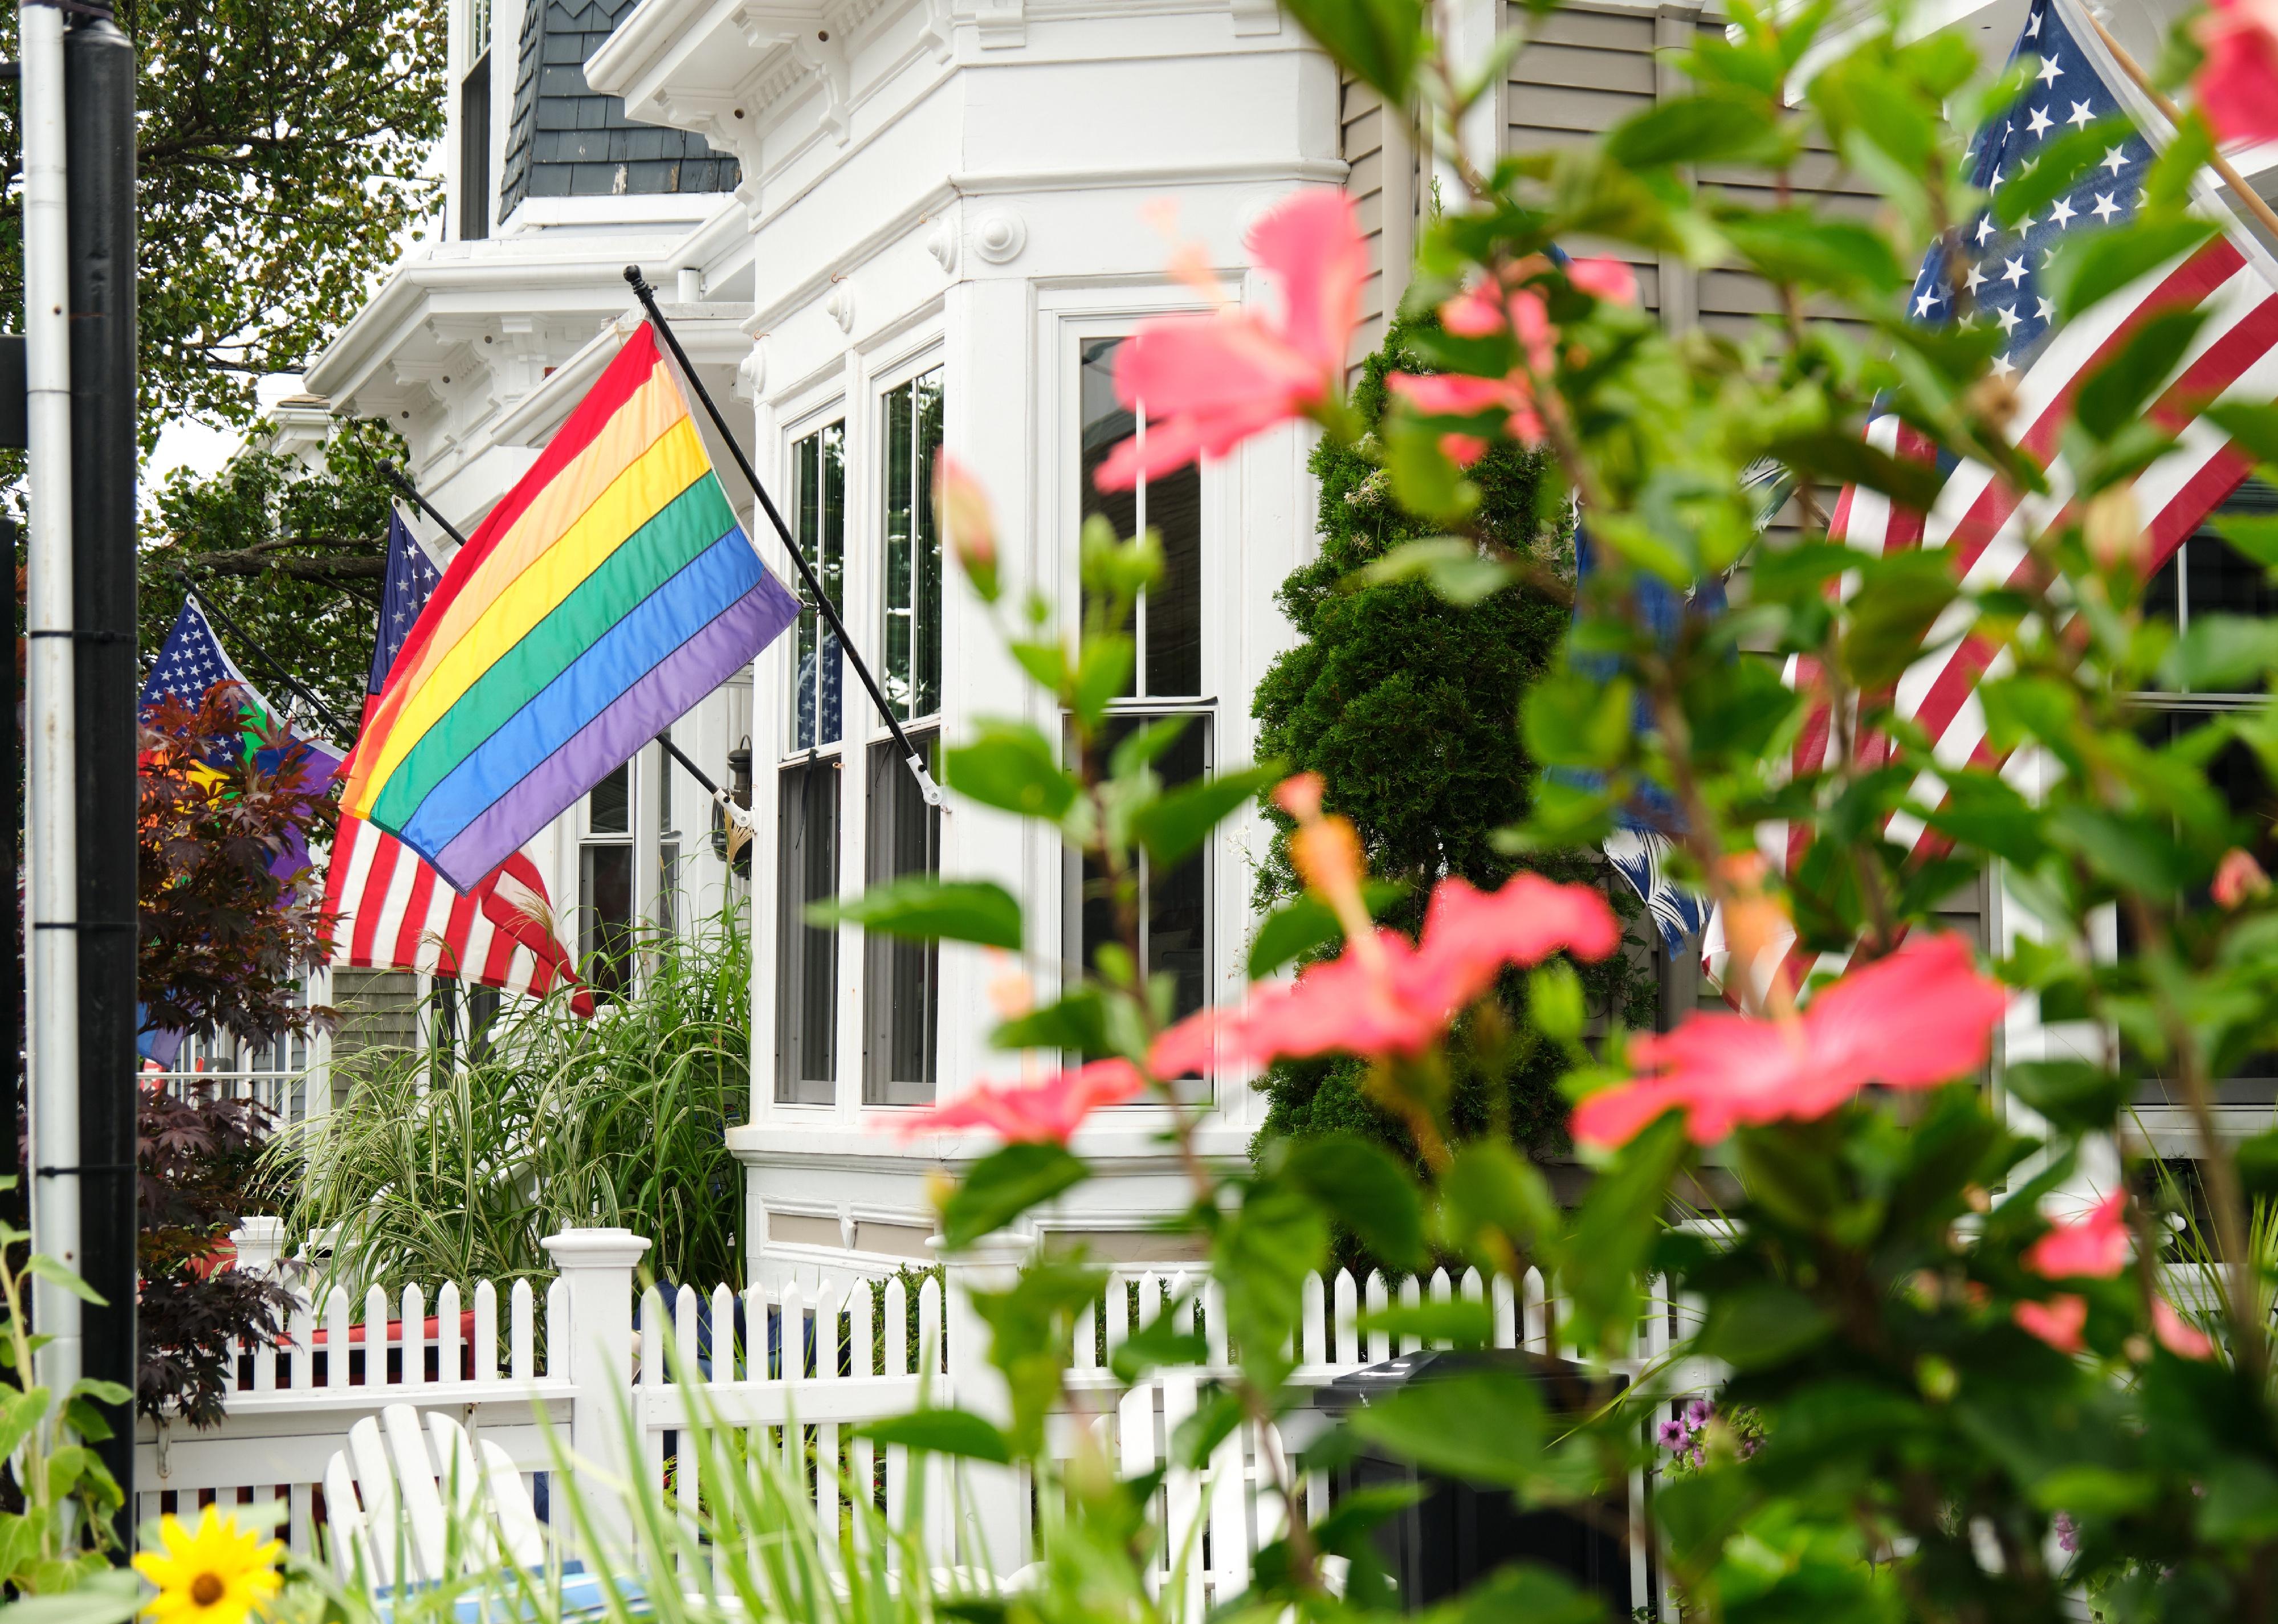
Michael Julian Photograph // Shutterstock
The best liberal places to live in America
A vibrant city setting, where the streets are highly walkable, homes are on the smaller side, and a diversity of ethnicities and races can be found throughout the community: This is the type of place where liberals prefer to live, according to a 2014 Pew Research Center study. Almost half of liberals prefer city living, with around two in 10 preferring suburban life.
Stacker analyzed data from Niche to rank the 50 best liberal places to live in the U.S. Niche sources data from several public data sources, including the Department of Education, Census Bureau, and FBI. This particular data set was acquired by filtering for “very liberal” politics on the 2022 Best Places to Live in America list.
“Very liberal” is based on presidential election results from 2012 and 2016 as compared to the average in the nation. It’s important to note that though all the populations are accurate, many of the areas listed are near a larger metropolitan area or city—for example, Radnor/Fort Myer Heights, Virginia, is right outside of Washington D.C.
Out of the top 50, the top 10 best liberal places to live in the U.S. scored well on public schools (Niche average of A+), outdoor space (Niche average of A), nightlife (Niche average of A+), health (Niche average of A+) and were good for families (Niche average of A+) but lacked in the housing (Niche average of B-) and cost of living (Niche average of C) categories.
All four regions in the continental U.S. (Northeast, South, Midwest, and West) are included in the top 10 best liberal places to live in the U.S. The median household income of the top 10 best liberal places to live in the U.S. only dipped below six figures in one location (Ocean Park, California), and even then, areas surrounding Santa Monica are affluent.
Ardmore, Pennsylvania, which is #1 on this list, is a Philadelphia suburb with a suburban and urban feel where many residents are liberal and young professionals. The historic Black community offers many amenities and institutions, including basketball courts, a swimming pool, a library, and a variety of vibrant restaurants, breweries, and live music at the Ardmore Music Hall.
College Terrace, California—#23 on this list and near the Stanford University campus—provides a college-town atmosphere and offers residents walkable streets filled with boutiques and restaurants. Arlington, Virginia, #50 on this list, is located in the Washington D.C. area, making it a perfect place for people who want to enjoy the D.C. nightlife—or who are happy to simply commute into the city during the week. Arlington has an urban atmosphere, many parks, coffee shops, bars, and restaurants, and residents include many young professionals.
Keep reading to learn more about the best liberal places to live in the U.S., including their population, median rent, median home value, area feel, and more.
You may also like: These are the best cities to raise a family in
![]()

Sean Pavone // Shutterstock
#50. Arlington, Virginia
– Population: 236,434
– Median household income: $122,604
– Median home value: $731,700
– Median rent: $2,005
– Percent of people who own a home: 43%
– Area feel: Urban

William A. Morgan // Shutterstock
#49. North Highland, Virginia
– Population: 4,423
– Median household income: $109,407
– Median home value: $516,370
– Median rent: $1,936
– Percent of people who own a home: 33%
– Area feel: null

BublikHaus // Shutterstock
#48. Community Center, California
– Population: 1,957
– Median household income: $242,292
– Median home value: $2,000,001
– Median rent: $2,982
– Percent of people who own a home: 80%
– Area feel: Sparse suburban

VDB Photos // Shutterstock
#47. Princeton Meadows, New Jersey
– Population: 14,261
– Median household income: $112,520
– Median home value: $14,261
– Median rent: $1,622
– Percent of people who own a home: 43%
– Area feel: Urban suburban mix

Arina P Habich // Shutterstock
#46. Agassiz, Massachusetts
– Population: 5,360
– Median household income: $115,077
– Median home value: $1,268,583
– Median rent: $2,391
– Percent of people who own a home: 31%
– Area feel: Urban
You may also like: Best places to live in the Midwest

michelmond // Shutterstock
#45. Greenmeadow, California
– Population: 2,132
– Median household income: $208,524
– Median home value: $1,968,986
– Median rent: $2,531
– Percent of people who own a home: 75%
– Area feel: Urban suburban mix

pbk-pg // Shutterstock
#44. Barron Park, California
– Population: 2,967
– Median household income: $202,703
– Median home value: $1,991,754
– Median rent: $2,665
– Percent of people who own a home: 65%
– Area feel: Urban suburban mix

JSvideos // Shutterstock
#43. Atlantic Station, Georgia
– Population: 2,378
– Median household income: $68,485
– Median home value: $209,826
– Median rent: $1,773
– Percent of people who own a home: 54%
– Area feel: Dense urban

Kirk J. Englehardt // Shutterstock
#42. Thornton Park, Florida
– Population: 376
– Median household income: $102,969
– Median home value: $418,784
– Median rent: $1,160
– Percent of people who own a home: 63%
– Area feel: Urban suburban mix

James Meyer // Shutterstock
#41. Whitefish Bay, Wisconsin
– Population: 13,890
– Median household income: $129,331
– Median home value: $393,300
– Median rent: $1,199
– Percent of people who own a home: 80%
– Area feel: Sparse suburban
You may also like: Here are the best places to live on the East Coast, from New England to the Florida Keys

dkdkdkdk // Shutterstock
#40. Professorville, California
– Population: 813
– Median household income: $245,749
– Median home value: $1,996,580
– Median rent: $3,424
– Percent of people who own a home: 59%
– Area feel: Sparse suburban

Chris Allan // Shutterstock
#39. North Berkeley, California
– Population: 7,624
– Median household income: $94,290
– Median home value: $1,110,325
– Median rent: $1,782
– Percent of people who own a home: 41%
– Area feel: Urban

Jon Bilous // Shutterstock
#38. Cambridge, Massachusetts
– Population: 117,822
– Median household income: $107,490
– Median home value: $843,100
– Median rent: $2,293
– Percent of people who own a home: 35%
– Area feel: Urban

Bill Chizek // Shutterstock
#37. Midtown, California
– Population: 10,581
– Median household income: $189,244
– Median home value: $1,998,327
– Median rent: $3,004
– Percent of people who own a home: 63%
– Area feel: Urban suburban mix

Rob Crandall // Shutterstock
#36. North Rosslyn, Virginia
– Population: 3,135
– Median household income: $150,454
– Median home value: $935,740
– Median rent: $2,493
– Percent of people who own a home: 45%
– Area feel: null
You may also like: Interior design trends from the 1920s to today

Farragutful // Wikimedia Commons
#35. Arlington Forest, Virginia
– Population: 2,811
– Median household income: $170,987
– Median home value: $758,498
– Median rent: $2,255
– Percent of people who own a home: 66%
– Area feel: null

Erickson Stock // Shutterstock
#34. Uptown, Florida
– Population: 1,627
– Median household income: $63,561
– Median home value: $182,197
– Median rent: $1,371
– Percent of people who own a home: 11%
– Area feel: Urban

Joseph Sohm // Shutterstock
#33. Evergreen Park, California
– Population: 1,269
– Median household income: $134,423
– Median home value: $1,528,175
– Median rent: $2,426
– Percent of people who own a home: 43%
– Area feel: Urban

Wangkun Jia // Shutterstock
#32. Peabody, Massachusetts
– Population: 12,719
– Median household income: $126,795
– Median home value: $934,453
– Median rent: $2,429
– Percent of people who own a home: 42%
– Area feel: Dense urban

Natcounts // Wikimedia Commons
#31. Collier Hills North, Georgia
– Population: 576
– Median household income: $77,984
– Median home value: $334,135
– Median rent: $1,711
– Percent of people who own a home: 32%
– Area feel: Dense urban
You may also like: Can you guess these famous skylines?

romakoma // Shutterstock
#30. Crescent Park, California
– Population: 4,018
– Median household income: $232,524
– Median home value: $1,992,024
– Median rent: $3,109
– Percent of people who own a home: 73%
– Area feel: Urban suburban mix

CC Photo Labs // Shutterstock
#29. Duveneck/St. Francis, California
– Population: 3,085
– Median household income: $231,908
– Median home value: $1,957,201
– Median rent: $3,082
– Percent of people who own a home: 84%
– Area feel: Urban suburban mix

melissamn // Shutterstock
#28. Clarendon/Courthouse, Virginia
– Population: 9,877
– Median household income: $125,792
– Median home value: $664,532
– Median rent: $2,321
– Percent of people who own a home: 22%
– Area feel: null

Mark and Anna Photography // Shutterstock
#27. Santa Monica, California
– Population: 91,600
– Median household income: $98,300
– Median home value: $1,452,100
– Median rent: $1,900
– Percent of people who own a home: 28%
– Area feel: Urban

John Phelan // Wikimedia Commons
#26. Oak Hill Park, Massachusetts
– Population: 1,593
– Median household income: $182,402
– Median home value: $822,109
– Median rent: $294
– Percent of people who own a home: 98%
– Area feel: Urban suburban mix
You may also like: Best big cities to live in America

Nicole Glass Photography // Shutterstock
#25. North Bethesda, Maryland
– Population: 49,719
– Median household income: $111,694
– Median home value: $594,100
– Median rent: $1,941
– Percent of people who own a home: 48%
– Area feel: Urban

John Phelan // Wikimedia Commons
#24. Riverside, Massachusetts
– Population: 11,912
– Median household income: $74,363
– Median home value: $1,067,010
– Median rent: $2,099
– Percent of people who own a home: 30%
– Area feel: Dense urban

trekandshoot // Shutterstock
#23. College Terrace, California
– Population: 1,559
– Median household income: $130,770
– Median home value: $2,000,001
– Median rent: $2,539
– Percent of people who own a home: 45%
– Area feel: Urban suburban mix

Wangkun Jia // Shutterstock
#22. East Cambridge, Massachusetts
– Population: 11,554
– Median household income: $104,221
– Median home value: $800,979
– Median rent: $2,485
– Percent of people who own a home: 27%
– Area feel: Dense urban

Swampyank // Wikimedia Commons
#21. Mid-Cambridge, Massachusetts
– Population: 14,088
– Median household income: $107,122
– Median home value: $854,840
– Median rent: $2,316
– Percent of people who own a home: 37%
– Area feel: Dense urban
You may also like: Best small towns to live in across America

perlphoto // Shutterstock
#20. Ballston/Virginia Square, Virginia
– Population: 13,929
– Median household income: $129,532
– Median home value: $561,254
– Median rent: $2,290
– Percent of people who own a home: 28%
– Area feel: null

Sheila Fitzgerald // Shutterstock
#19. Macalester-Groveland, Minnesota
– Population: 18,951
– Median household income: $95,948
– Median home value: $382,714
– Median rent: $1,072
– Percent of people who own a home: 71%
– Area feel: Dense suburban

Wangkun Jia // Shutterstock
#18. Wayland, Massachusetts
– Population: 13,823
– Median household income: $192,632
– Median home value: $733,300
– Median rent: $1,263
– Percent of people who own a home: 91%
– Area feel: Sparse suburban

Diego Grandi // Shutterstock
#17. Old Palo Alto, California
– Population: 3,525
– Median household income: $248,610
– Median home value: $1,994,073
– Median rent: $2,850
– Percent of people who own a home: 77%
– Area feel: Sparse suburban

Kosatka // Shutterstock
#16. Wilshire/Montana, California
– Population: 14,828
– Median household income: $112,966
– Median home value: $1,201,595
– Median rent: $2,135
– Percent of people who own a home: 21%
– Area feel: Dense urban
You may also like: What the 50 biggest cities in America looked like 50 years ago

rblfmr // Shutterstock
#15. Downtown North, California
– Population: 3,215
– Median household income: $81,663
– Median home value: $1,575,707
– Median rent: $1,845
– Percent of people who own a home: 28%
– Area feel: Dense urban

Vineyard Perspective // Shutterstock
#14. Manhasset Hills, New York
– Population: 3,808
– Median household income: $165,833
– Median home value: $847,600
– Median rent: $2,768
– Percent of people who own a home: 92%
– Area feel: Rural

Dr.frog // Wikimedia Commons
#13. Cambridgeport, Massachusetts
– Population: 13,713
– Median household income: $110,565
– Median home value: $887,195
– Median rent: $2,309
– Percent of people who own a home: 35%
– Area feel: Dense urban

John Phelan // Wikimedia Commons
#12. The Port, Massachusetts
– Population: 6,658
– Median household income: $101,998
– Median home value: $805,299
– Median rent: $2,064
– Percent of people who own a home: 33%
– Area feel: Urban suburban mix

Jon Osumi // Shutterstock
#11. Ventura, California
– Population: 4,011
– Median household income: $165,978
– Median home value: $1,440,763
– Median rent: $2,386
– Percent of people who own a home: 38%
– Area feel: Urban
You may also like: The best places to live out your West Coast retirement dreams

RellMade // Shutterstock
#10. Clayton, Missouri
– Population: 16,763
– Median household income: $108,387
– Median home value: $605,700
– Median rent: $1,334
– Percent of people who own a home: 57%
– Area feel: Urban suburban mix

Farragutful // Wikimedia Commons
#9. Colonial Village, Virginia
– Population: 3,071
– Median household income: $106,428
– Median home value: $376,387
– Median rent: $2,010
– Percent of people who own a home: 32%
– Area feel: null

Brian Balik // Shutterstock
#8. Bluemont, Virginia
– Population: 7,641
– Median household income: $182,295
– Median home value: $789,707
– Median rent: $2,186
– Percent of people who own a home: 66%
– Area feel: null

Dr.frog // Wikimedia Commons
#7. Mid-City, California
– Population: 16,938
– Median household income: $108,407
– Median home value: $1,029,245
– Median rent: $1,996
– Percent of people who own a home: 20%
– Area feel: Dense urban

Franco Francisco Maria // Shutterstock
#6. University South, California
– Population: 4,040
– Median household income: $131,190
– Median home value: $1,773,512
– Median rent: $2,186
– Percent of people who own a home: 34%
– Area feel: Dense urban
You may also like: Metros where people owe more than their homes are worth

AITFFan1 // Wikimedia Commons
#5. Great Neck Gardens, New York
– Population: 1,213
– Median household income: $218,603
– Median home value: $980,700
– Median rent: null
– Percent of people who own a home: 60%
– Area feel: Sparse suburban

Wangkun Jia // Shutterstock
#4. Brookline, Massachusetts
– Population: 59,223
– Median household income: $113,642
– Median home value: $1,006,200
– Median rent: $2,305
– Percent of people who own a home: 49%
– Area feel: Urban

Creative Commons // Wikimedia Commons
#3. Ocean Park, California
– Population: 12,072
– Median household income: $96,580
– Median home value: $1,260,192
– Median rent: $1,856
– Percent of people who own a home: 20%
– Area feel: Dense urban

Andriy Blokhin // Shutterstock
#2. Radnor/Fort Myer Heights, Virginia
– Population: 11,927
– Median household income: $116,508
– Median home value: $536,537
– Median rent: $2,051
– Percent of people who own a home: 26%
– Area feel: null

Ii2nmd // Wikimedia Commons
#1. Ardmore, Pennsylvania
– Population: 13,567
– Median household income: $102,092
– Median home value: $346,300
– Median rent: $1,469
– Percent of people who own a home: 64%
– Area feel: Urban suburban mix
You may also like: Oldest cities in America